
}

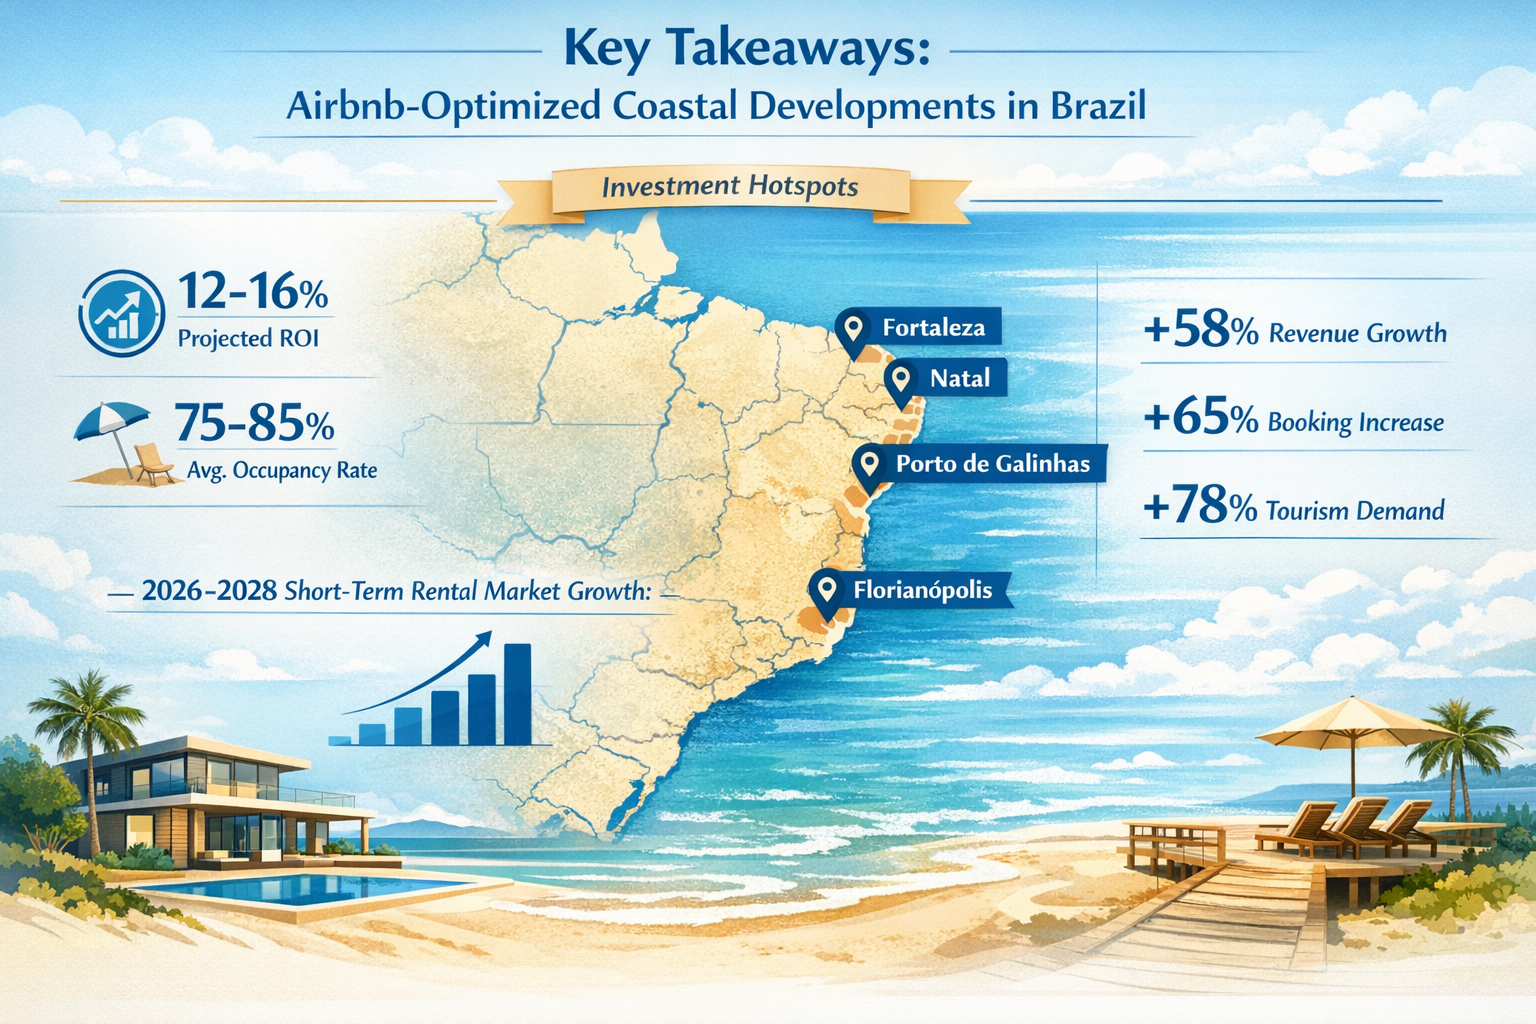
Brazil’s coastal real estate market is experiencing a golden moment in 2026. With international tourism reaching record levels and a currency that remains attractive to foreign investors, developers who understand the nuances of short-term rental optimization are positioned to capture exceptional returns. The convergence of surging travel demand, strategic location selection, and purpose-built design creates unprecedented opportunities for those willing to look beyond traditional development models.
The landscape of Airbnb-optimized developments in Brazil’s coastal hotspots demands a sophisticated approach. Success in 2026 requires more than simply building apartments near the beach—it requires understanding occupancy patterns, identifying undersaturated markets, and designing properties that command premium nightly rates while maximizing booking frequency. This comprehensive guide reveals the yield strategies that separate high-performing developments from mediocre ones.
Key Takeaways
- 🏖️ Brazil hosts approximately 350,000 active Airbnb listings across major markets, with emerging coastal neighborhoods offering significantly less competition than saturated central beach zones
- 📊 Typical occupancy rates average 50% (180 booked nights annually), but top-tier properties in strategic locations achieve 65%+ through optimized design and management
- 💰 Seasonal revenue swings are dramatic—Florianópolis properties range from R$3,600 monthly in low season to R$8,400+ during summer peaks, with Rio’s Carnival week generating 50% demand surges
- 🏗️ Larger units face less competition—while one-bedroom apartments dominate supply (86% in São Paulo, 67% in Rio), two-bedroom properties capture higher revenues with better occupancy
- 🎯 Undersaturated opportunities exist in neighborhoods like Campeche (Florianópolis), Botafogo and Flamengo (Rio), and Rio Vermelho (Salvador) where visitor demand exceeds current supply
Understanding Brazil’s Short-Term Rental Landscape in 2026
The Brazilian vacation rental market has matured significantly, driven by record international tourism of 9.2 million visitors in 2025 and 12 consecutive months of domestic air travel increases[1]. This growth has created a sophisticated ecosystem where data-driven development strategies outperform speculative approaches.
Market Size and Distribution
Brazil’s four largest Airbnb markets—Rio de Janeiro (55,664 listings), São Paulo (57,193 listings), Florianópolis (34,817 listings), and Salvador (14,024 listings)—account for 161,700 of the nation’s approximately 350,000 active listings[1]. This concentration reveals both opportunity and challenge for developers pursuing high-return investment locations.
The distribution of these listings isn’t uniform. Central beach neighborhoods in major cities face intense competition, while emerging coastal zones remain undersaturated despite growing visitor interest. Developers who identify these gaps before market saturation occurs capture first-mover advantages that translate directly to superior occupancy rates.
Occupancy Benchmarks and Revenue Reality
Realistic expectations form the foundation of successful development planning. Across Brazil, typical occupancy rates average 50%, translating to approximately 180 booked nights annually[1]. However, this average masks significant variation:
- Top-tier properties: 65%+ occupancy (237+ nights)
- Well-managed properties: 55-60% occupancy (200-219 nights)
- Average properties: 45-55% occupancy (164-200 nights)
- Underperforming properties: Below 40% occupancy (under 146 nights)
Fortaleza provides a concrete example, with average occupancy at 43% and $7,052 average annual revenue per listing[5]. Top-performing properties in this market (top 10%) achieve $1,672+ monthly earnings, while median properties generate $632 monthly[5]. The performance gap between optimized and standard properties represents the opportunity for strategic developers.
Camboriú demonstrates the risks of market saturation, showing lower occupancy at 26% with $4,065 average revenue[3]. This reflects both oversupply and a market preference for extended stays, with 36.4% of listings requiring 30+ night minimums[3]—a configuration that reduces flexibility and booking frequency.
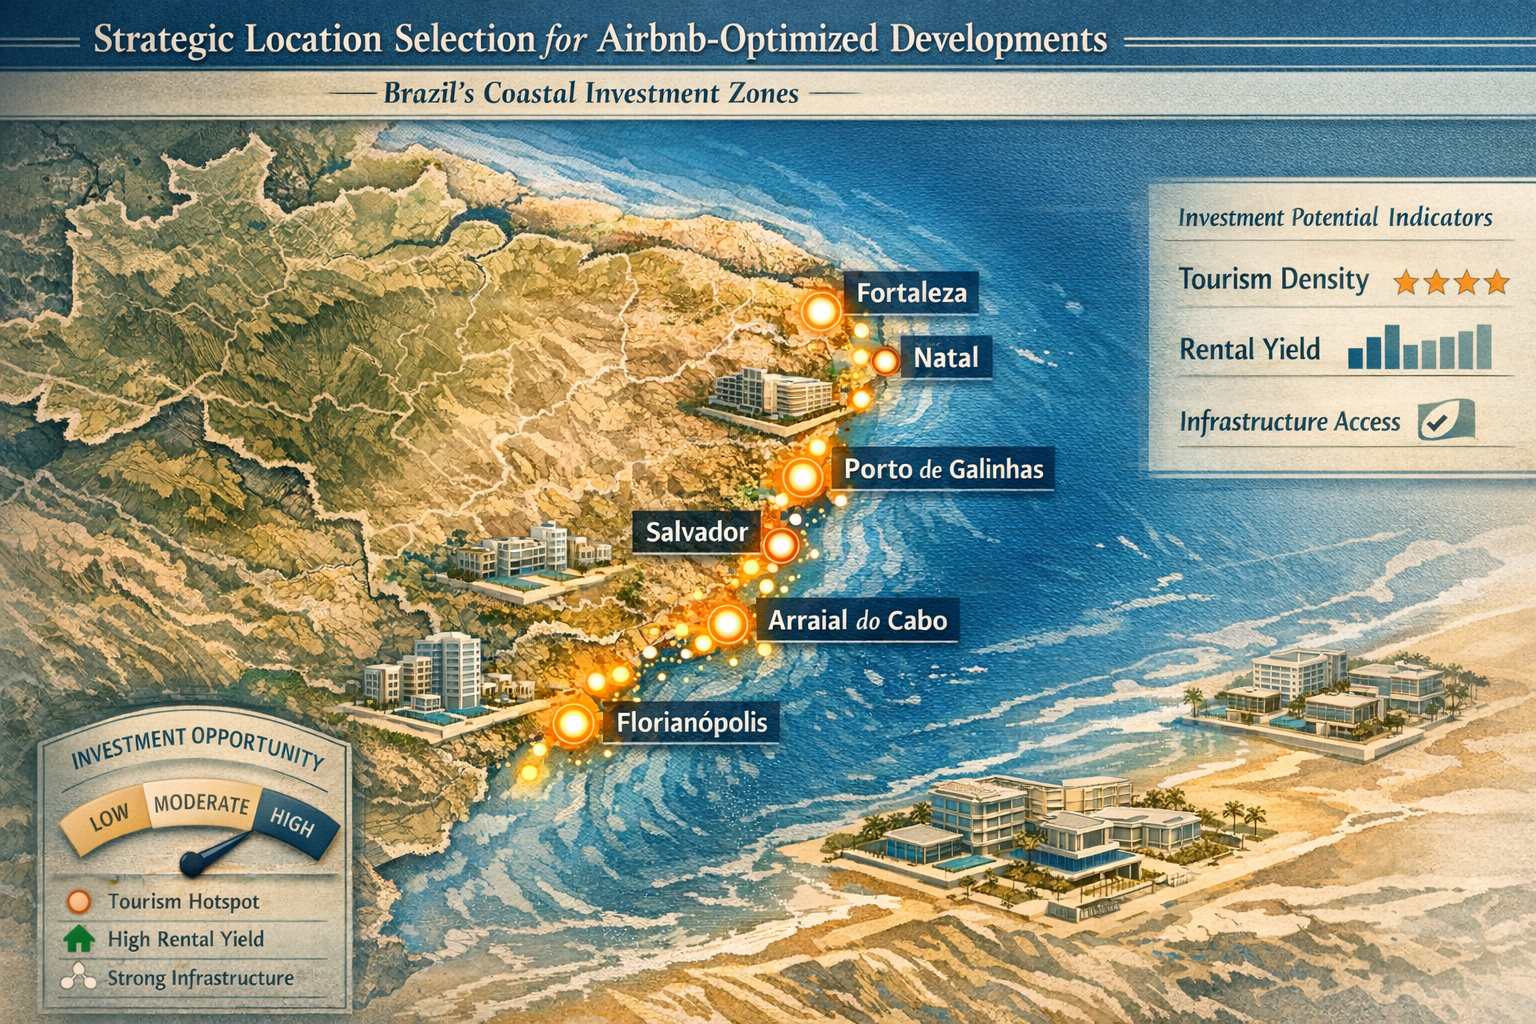
Strategic Location Selection for Airbnb-Optimized Developments in Brazil’s Coastal Hotspots
Location determines the ceiling of potential performance. While design and management influence how close a property comes to that ceiling, no amount of optimization can overcome a fundamentally poor location choice.
Identifying Undersaturated Coastal Markets
The most profitable opportunities in 2026 exist in neighborhoods where visitor demand exceeds current supply. Research has identified specific undersaturated zones that offer developers competitive advantages[1]:
Rio de Janeiro:
- ✅ Botafogo: Excellent connectivity to beaches and downtown, lower listing density than Copacabana/Ipanema
- ✅ Flamengo: Waterfront location with metro access, significantly less competition than premium beach zones
São Paulo (coastal access markets):
- ✅ Vila Mariana: Well-connected neighborhood with lower saturation than central districts
- ✅ Moema: Upscale area attracting business and leisure travelers
Florianópolis:
- ✅ Campeche: Beautiful beach with growing popularity but far fewer listings than central Florianópolis beaches
Salvador:
- ✅ Rio Vermelho: Cultural hub with beach access, less saturated than historic center
These neighborhoods share common characteristics: proximity to key attractions, good infrastructure, and visitor appeal without the intense competition of primary tourist zones. Developers entering these markets capture higher occupancy rates simply through reduced competition.
Avoiding Saturated Zones
Equally important is understanding where not to develop. Saturated zones include[1]:
- Central beach neighborhoods in Rio (Copacabana, Ipanema, Leblon)
- Prime beach areas in Florianópolis
- Historic center zones in Salvador
- Central São Paulo districts
While these areas command premium rates during peak seasons, the sheer volume of competing listings suppresses occupancy rates and forces aggressive pricing during shoulder and low seasons. The growth dynamics in emerging neighborhoods often deliver superior long-term returns compared to established tourist centers.
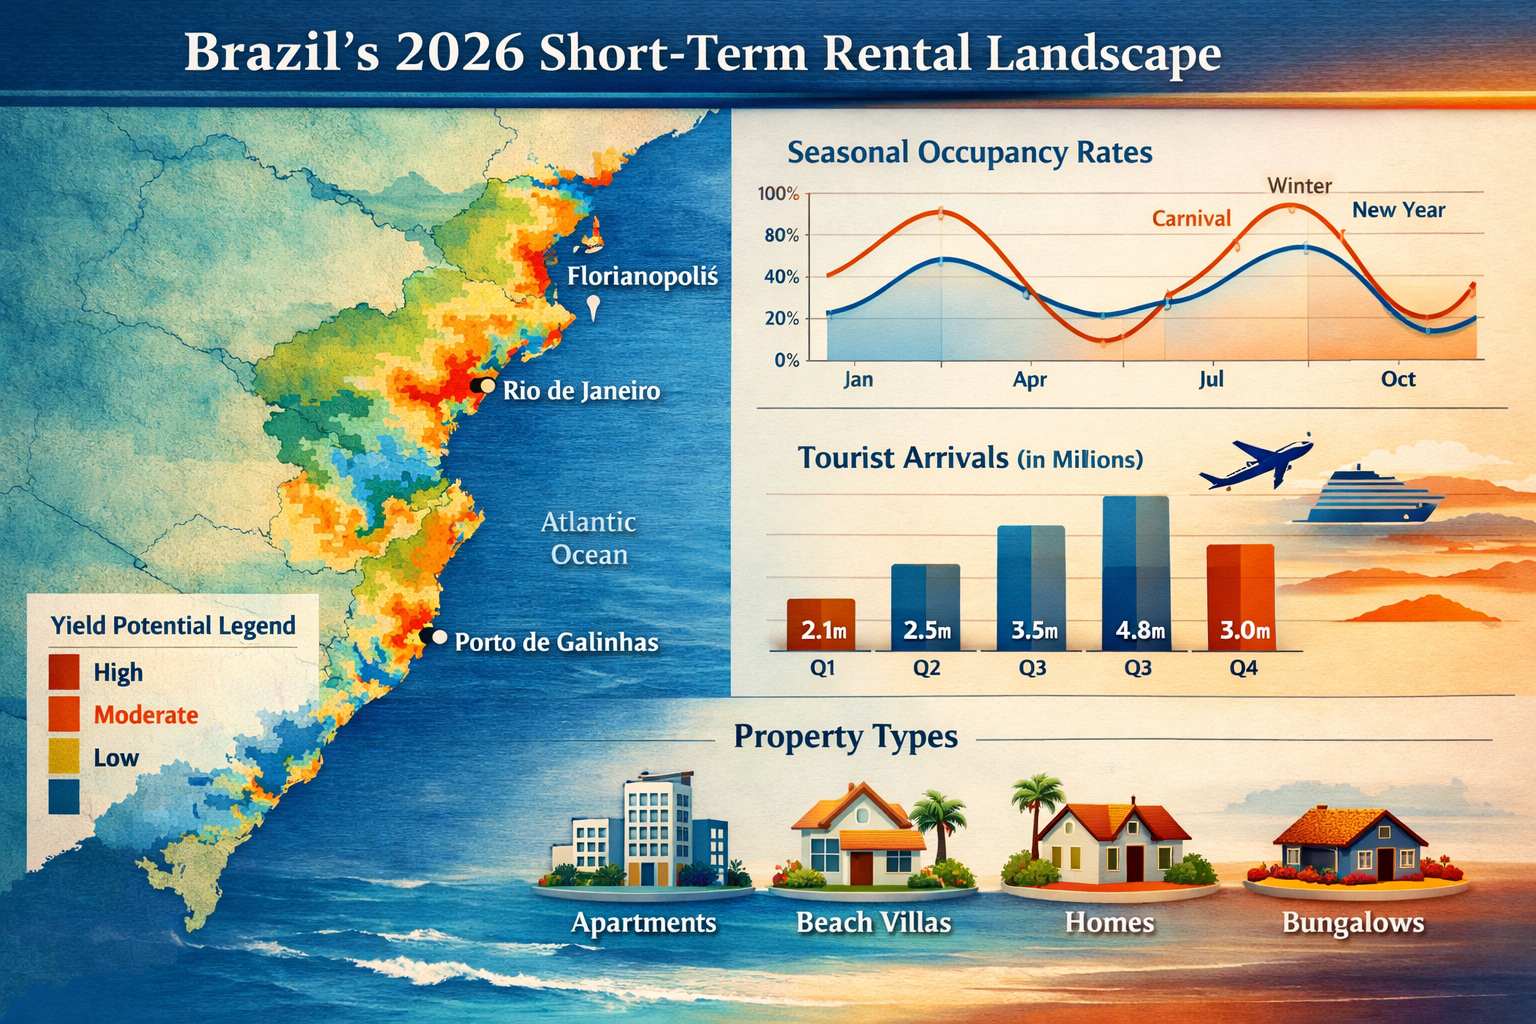
Seasonal Demand Patterns and Revenue Concentration
Understanding seasonal fluctuations is critical for financial modeling. Beach destinations experience dramatic seasonal swings—Florianópolis properties range from R$3,600 monthly in low season to R$8,400+ during summer peaks[1]. This 133% variance means that a property’s annual revenue often concentrates in just 3-4 months.
Rio de Janeiro’s 2026 Carnival exemplifies concentrated revenue opportunities. The event generated a 50% surge in Airbnb demand, with premium neighborhoods achieving two to three times normal nightly rates during peak week[2]. A single Carnival week can match several off-season months in revenue, making Rio properties particularly attractive despite higher competition.
Developers must design financial models that account for:
| Season | Occupancy Expectation | Rate Premium | Revenue Contribution |
|---|---|---|---|
| High Season (Dec-Feb) | 75-85% | 150-250% of base | 40-50% of annual revenue |
| Shoulder Season (Mar-May, Sep-Nov) | 45-55% | 100-120% of base | 30-35% of annual revenue |
| Low Season (Jun-Aug) | 25-35% | 70-90% of base | 15-25% of annual revenue |
Design and Configuration Strategies for Maximum Yield
Physical design directly impacts booking conversion, nightly rates, and operational efficiency. Airbnb-optimized developments in Brazil’s coastal hotspots require specific features that traditional residential developments often lack.
Unit Size and Bedroom Configuration
Market data reveals a critical insight: one-bedroom apartments dominate supply (86% in São Paulo, 67% in Rio)[1], creating significant opportunity for larger units. Two-bedroom configurations offer multiple advantages:
Revenue Benefits:
- Higher nightly rates (typically 40-60% premium over one-bedroom)
- Attract family groups and larger parties
- Better performance during shoulder seasons when business travelers seek space
- Reduced competition in most markets
Operational Benefits:
- Higher revenue per cleaning (same labor, higher rates)
- Lower turnover costs as percentage of revenue
- More stable occupancy patterns
The optimal configuration for coastal markets in 2026:
- Studio/1BR: 35-45m² (budget-conscious travelers, solo/couples)
- 2BR: 55-75m² (families, small groups—recommended focus)
- 3BR: 85-110m² (larger groups, premium segment)
Developers should consider allocating 60-70% of units to two-bedroom configurations in undersaturated markets, with the remainder split between studios and three-bedroom units for market diversification.
Essential Design Features
Successful vacation rentals incorporate specific design elements that enhance guest experience and justify premium pricing:
Outdoor Spaces:
- Private balconies or terraces (minimum 8m²)
- Ocean or landscape views where possible
- Outdoor furniture and dining capability
- Privacy screening from adjacent units
Kitchen and Dining:
- Full kitchen equipment (not kitchenette)
- Quality appliances (refrigerator, stove, microwave)
- Dining table seating full occupancy
- Coffee maker and basic cooking tools
Bathroom Optimization:
- Minimum 1.5 bathrooms for 2BR units
- Walk-in showers with quality fixtures
- Adequate storage and counter space
- Ventilation and natural light
Technology Integration:
- High-speed WiFi (minimum 100Mbps)
- Smart locks for keyless entry
- Smart TV with streaming capabilities
- USB charging ports throughout
- Air conditioning in all rooms
Storage Solutions:
- Dedicated closet space for guests
- Secure storage for owner/management supplies
- Luggage storage areas
- Beach equipment storage (chairs, umbrellas)
Aesthetic and Finishes
The visual presentation in listing photos directly impacts booking conversion. Developers should specify:
- Neutral base palette with coastal accent colors
- Durable, easy-to-clean materials (porcelain tile, quartz counters)
- Contemporary furniture that photographs well
- Adequate lighting (natural and artificial)
- Cohesive design theme throughout the unit
Properties with professional interior design consistently outperform similar units with basic finishes, often commanding 15-25% rate premiums while maintaining higher occupancy.
Financial Modeling and Yield Optimization for 2026 Developers
Accurate financial projections separate successful developments from disappointing ones. The unique characteristics of short-term rental investments require specialized modeling approaches.
Revenue Projection Framework
Conservative revenue modeling should account for realistic occupancy and seasonal variation:
Year 1 (Ramp-up):
- Occupancy: 35-45% (property establishing reputation)
- Average nightly rate: 80-90% of market comparable
- Focus on building reviews and ratings
Year 2-3 (Stabilization):
- Occupancy: 50-60% (market average to above-average)
- Average nightly rate: 100-110% of market comparable
- Optimized pricing and established presence
Year 4+ (Mature Performance):
- Occupancy: 55-65% (well-managed property)
- Average nightly rate: 110-120% of market comparable
- Potential for super-host status and premium positioning
Operating Cost Considerations
Vacation rental operating costs differ significantly from traditional residential rentals:
Variable Costs (per booking):
- Cleaning: R$150-300 per turnover
- Laundry: R$50-100 per turnover
- Consumables (toiletries, coffee, etc.): R$30-50 per booking
Fixed Monthly Costs:
- Property management: 15-25% of gross revenue
- Utilities: R$200-400 (higher than residential due to guest usage)
- Internet/cable: R$150-250
- Condominium fees: R$300-800 (varies by building)
- Property tax: R$100-300 monthly equivalent
- Insurance: R$150-300
- Maintenance reserve: 5-10% of gross revenue
Platform Fees:
- Airbnb commission: 3% (host fee) + 14-16% (guest fee, passed to guest)
- Other platforms (Booking.com, VRBO): 15-20% of booking value
Total operating costs typically range from 45-60% of gross revenue for professionally managed properties, with economies of scale available for developers managing multiple units.
Currency Advantage and Foreign Investment
The Brazilian Real’s relative weakness against major currencies creates compelling opportunities for foreign investors and developers. Properties purchased or developed in Reais generate revenue that can be converted to stronger currencies, while attracting international travelers who benefit from favorable exchange rates.
This dynamic makes Brazil particularly attractive for cryptocurrency and international real estate investment strategies, where capital can move efficiently across borders to capitalize on currency differentials.
Development and Construction Strategies
The construction phase determines both initial investment and long-term operational efficiency. Strategic developers optimize for total cost of ownership, not just initial construction costs.
Pre-Construction Planning
Successful Airbnb-optimized developments in Brazil’s coastal hotspots begin with comprehensive planning:
Market Research:
- Competitive analysis of existing listings
- Demand assessment by season and unit type
- Rate benchmarking and revenue projections
- Regulatory compliance verification
Site Selection:
- Proximity to beaches and attractions (within 500m ideal)
- Access to public transportation
- Parking availability (increasingly important)
- Neighborhood safety and infrastructure
- Future development plans in area
Regulatory Due Diligence:
- Zoning verification for short-term rentals
- Condominium rules regarding vacation rentals
- Local licensing requirements
- Tax obligations and registration
Construction Quality and Specifications
Vacation rental properties experience higher wear than traditional residential units due to frequent turnover. Developers should specify:
Enhanced Durability:
- Commercial-grade flooring (porcelain tile, luxury vinyl plank)
- Stain-resistant fabrics and finishes
- Impact-resistant wall surfaces
- Heavy-duty plumbing fixtures
- Reinforced door hardware
Simplified Maintenance:
- Easy-to-clean surfaces throughout
- Standardized fixtures across units (reduces spare parts inventory)
- Accessible mechanical systems
- Durable landscaping with low maintenance requirements
Sound Insulation:
- Enhanced acoustic separation between units
- Impact-resistant floor underlayment
- Insulated interior walls
- Quality windows and doors
The incremental cost of these specifications (typically 8-12% premium over basic residential construction) pays for itself through reduced maintenance costs and extended replacement cycles.
Phased Development Approach
For larger projects, phased development offers significant advantages:
Phase 1 (Pilot):
- 20-30% of total units
- Test market response and design assumptions
- Establish operational systems
- Generate cash flow for subsequent phases
Phase 2 (Expansion):
- 40-50% of total units
- Incorporate lessons from Phase 1
- Scale operational infrastructure
- Benefit from established reputation
Phase 3 (Completion):
- Remaining units
- Optimized design and operations
- Premium pricing from established project reputation
- Reduced marketing costs
This approach reduces risk while allowing developers to optimize based on real market performance. Properties purchased during pre-construction phases often appreciate significantly before completion as the project establishes market presence.
Operational Excellence and Management Strategies
Even perfectly designed properties in ideal locations underperform without excellent operations. The gap between top-performing and average properties often lies in management quality rather than physical attributes.
Professional Management vs. Self-Management
Developers must decide between self-management and professional property management:
Professional Management Benefits:
- 24/7 guest communication and support
- Optimized dynamic pricing algorithms
- Professional photography and listing optimization
- Established operational systems
- Scalability across multiple properties
- Higher occupancy through expertise
Professional Management Costs:
- 15-25% of gross revenue
- Setup fees (R$500-2,000 per property)
- Potential furniture package requirements
Self-Management Considerations:
- Requires significant time investment
- Learning curve impacts initial performance
- Difficult to scale beyond 3-5 properties
- 24/7 availability demands
- Technology and systems investment
For developers with multiple units, professional management typically delivers superior net returns despite the fee structure, particularly when managing 5+ properties where economies of scale emerge.
Dynamic Pricing and Revenue Management
Static pricing leaves significant revenue on the table. Successful operators employ sophisticated pricing strategies:
Factors in Dynamic Pricing:
- Seasonal demand patterns
- Local events and holidays (Carnival, New Year’s, etc.)
- Day of week (weekends command premiums)
- Booking lead time (last-minute vs. advance bookings)
- Competitive pricing movements
- Weather forecasts
- Historical performance data
Technology Solutions:
- Automated pricing tools (PriceLabs, Beyond Pricing, Wheelhouse)
- Channel management systems
- Integrated booking calendars
- Performance analytics dashboards
Properties using dynamic pricing typically achieve 12-18% higher revenue than those with static rates, with the most sophisticated systems capturing 20%+ premiums during peak demand periods.
Guest Experience and Review Management
Reviews directly impact booking conversion and allowable pricing. Properties with 4.8+ ratings and 25+ reviews convert bookings at rates 40-60% higher than those with fewer or lower-rated reviews.
Review Optimization Strategies:
- Exceed expectations on cleanliness (most important factor)
- Provide comprehensive property information before arrival
- Smooth check-in/check-out processes
- Rapid response to guest communications
- Small touches (welcome basket, local recommendations, beach equipment)
- Proactive issue resolution
- Polite review requests after checkout
The first 10-15 reviews are critical for establishing property reputation. Developers should consider offering modest discounts (10-15%) during initial bookings to accelerate review accumulation while maintaining high standards.
Regulatory Compliance and Risk Management
The regulatory environment for short-term rentals continues evolving in Brazil. Developers must build compliance into their projects from inception.
Current Regulatory Landscape
Short-term rental regulations vary by municipality in Brazil:
Common Requirements:
- Property registration with local authorities
- Tax registration and collection (ISS, municipal tourism tax)
- Safety standards compliance (fire safety, emergency exits)
- Condominium approval (where applicable)
- Business license for commercial operation
Emerging Trends:
- Increasing registration requirements
- Occupancy limits and noise regulations
- Neighbor complaint procedures
- Platform reporting requirements
- Professional management standards
Developers should consult local legal counsel during site selection to verify current regulations and anticipated changes. Properties in municipalities with clear, stable regulatory frameworks carry less risk than those in jurisdictions with uncertain or evolving rules.
Insurance and Liability Protection
Vacation rentals require specialized insurance coverage:
Essential Coverage:
- Property damage (higher limits than residential)
- Liability insurance (minimum R$500,000)
- Loss of income coverage
- Guest injury protection
- Contents coverage (furniture, equipment)
Risk Mitigation Strategies:
- Security deposits (typically 20-30% of booking value)
- Damage waiver programs
- Guest screening procedures
- Clear house rules and policies
- Property inspection between bookings
- Incident documentation protocols
Annual insurance costs typically range from 0.5-1.2% of property value, significantly higher than traditional residential insurance but essential for protecting investment.
Technology and Automation for Scale
Technology enables developers to scale operations efficiently while maintaining quality standards across multiple properties.
Essential Technology Stack
Modern vacation rental operations require integrated technology systems:
Core Systems:
- Property Management System (PMS): Centralized booking, calendar, and guest management (Guesty, Hostaway, Lodgify)
- Channel Manager: Synchronizes listings across platforms (Airbnb, Booking.com, VRBO)
- Dynamic Pricing Tool: Automated rate optimization
- Smart Locks: Keyless entry with automated code generation
- Noise Monitoring: Early detection of parties or disturbances
- Guest Communication: Automated messages and 24/7 support
Supporting Tools:
- Professional photography services
- Virtual tour technology
- Digital guidebooks
- Maintenance request systems
- Cleaning coordination platforms
- Financial reporting and analytics
Automation Opportunities
Strategic automation reduces operational costs while improving guest experience:
Pre-Arrival:
- Automated booking confirmations
- Pre-check-in information delivery
- Access code generation and delivery
- Upsell opportunities (early check-in, late checkout)
During Stay:
- Digital guidebook access
- Automated check-in instructions
- Mid-stay check-in messages
- Issue reporting systems
Post-Departure:
- Automated checkout instructions
- Damage inspection triggers
- Review requests
- Feedback collection
- Rebooking incentives
Properties with comprehensive automation achieve 30-40% lower operational costs per booking while maintaining higher guest satisfaction scores.
Market Outlook and Future Trends for 2026-2028
Understanding emerging trends allows developers to future-proof their investments and capture evolving opportunities.
Demand Drivers Through 2028
Several factors support continued growth in Brazil’s vacation rental market:
International Tourism Growth:
- Projected 8-12% annual increase in international arrivals
- Continued currency advantages for foreign visitors
- Improved air connectivity to secondary cities
- Growing middle class in source markets (Latin America, Europe)
Domestic Travel Expansion:
- Rising Brazilian middle class
- Preference for vacation rentals over hotels (especially post-pandemic)
- Remote work enabling extended stays
- Increased domestic air travel capacity
Investment Capital Flows:
- Foreign direct investment in Brazilian real estate
- Cryptocurrency adoption enabling international transactions
- Growing awareness of Brazil’s investment opportunities
- Favorable yield comparisons to developed markets
Emerging Guest Preferences
Guest expectations continue evolving, requiring developers to anticipate future demands:
Extended Stays:
- Growing “workcation” market (1-4 week bookings)
- Digital nomad targeting
- Seasonal residents (snowbirds)
- Design implications: dedicated workspace, faster internet, larger living areas
Sustainability Features:
- Solar power systems
- Water conservation measures
- Eco-friendly materials and products
- Waste reduction programs
- Local sourcing emphasis
Experience Integration:
- Partnerships with local tour operators
- Curated local recommendations
- Activity booking services
- Cultural immersion opportunities
- Community connection programs
Technology Expectations:
- Voice-controlled smart home features
- Streaming entertainment systems
- High-speed internet (200Mbps+)
- Electric vehicle charging
- Contactless everything
Developers incorporating these elements position their properties for sustained competitive advantage as market expectations evolve.
Competitive Landscape Evolution
The vacation rental market in Brazil is professionalizing rapidly:
Trends:
- Institutional capital entering the market
- Professional management companies expanding
- Purpose-built vacation rental developments
- Branded residence concepts
- Technology-enabled operations becoming standard
Implications for Developers:
- Higher quality standards required for competitiveness
- Operational excellence becoming differentiator
- Scale advantages in marketing and operations
- Need for capital efficiency and professional execution
- Opportunities in emerging markets before institutional entry
The window for capturing first-mover advantages in undersaturated markets is finite. Developers who execute quality projects in strategic locations during 2026-2027 will establish market positions that become increasingly difficult for later entrants to challenge.
Conclusion
Airbnb-optimized developments in Brazil’s coastal hotspots represent one of the most compelling real estate investment opportunities in 2026. The convergence of record tourism demand, favorable currency dynamics, and identifiable undersaturated markets creates conditions for exceptional returns—but only for developers who approach these projects with sophisticated strategies.
Success requires moving beyond conventional residential development thinking. Location selection must prioritize emerging neighborhoods over saturated tourist centers. Design must emphasize two-bedroom configurations with vacation-specific features rather than standard residential layouts. Financial modeling must account for dramatic seasonal variations and realistic occupancy expectations. Operations must leverage technology and professional management to achieve top-tier performance.
The data is clear: top-performing properties achieve 65%+ occupancy and generate revenue multiples of average listings in the same markets. This performance gap represents the opportunity for strategic developers who implement the yield optimization strategies outlined in this guide.
Next Steps for Developers
Immediate Actions:
- Conduct market analysis of specific coastal neighborhoods using current occupancy and revenue data
- Verify regulatory requirements in target municipalities before site acquisition
- Develop financial models incorporating realistic occupancy curves and seasonal variations
- Engage professional management companies early in the planning process
- Visit comparable properties to understand guest expectations and competitive standards
Strategic Considerations:
- Prioritize undersaturated neighborhoods over established tourist zones
- Design for two-bedroom configurations as primary unit type
- Specify commercial-grade materials and vacation-specific features
- Plan for professional management and technology integration from inception
- Consider phased development to test and optimize before full buildout
Long-term Success Factors:
- Operational excellence through professional management or sophisticated self-management systems
- Continuous optimization of pricing, guest experience, and property presentation
- Community building and repeat guest cultivation
- Adaptation to evolving guest preferences and market conditions
- Sustainable practices and local integration
The Brazilian coastal vacation rental market offers substantial opportunities for developers who execute strategically. Those who combine data-driven location selection, purpose-built design, and operational excellence will capture the premium returns available in this dynamic and growing market.
For developers seeking to enter this market, partnering with experienced local development companies who understand regional dynamics, regulatory requirements, and operational best practices can significantly reduce risk while accelerating time to market. The opportunities are substantial, but the window for capturing first-mover advantages in emerging markets is limited.
The question for developers in 2026 is not whether Brazil’s coastal vacation rental market offers attractive returns—the data confirms it does. The question is whether you’ll implement the strategic approaches necessary to capture those returns while others settle for average performance. The choice, and the opportunity, is yours.
References
[1] Brazil Airbnb – https://thelatinvestor.com/blogs/news/brazil-airbnb
[2] Airbnb Demand Rio 2026 Carnival – https://www.oabitat.com/en/airbnb-demand-rio-2026-carnival/
[3] Camboriú – https://www.airroi.com/report/world/brazil/santa-catarina/cambori%C3%BA
[5] Fortaleza – https://www.airroi.com/report/world/brazil/cear%C3%A1/fortaleza