Brazil’s weakening Real has created an unprecedented opportunity window for international investors seeking double-digit returns in the short-term rental market. While major cities like Rio de Janeiro and São Paulo dominate headlines, secondary coastal and lifestyle destinations are quietly delivering some of the highest yields in Latin America—with far less competition and regulatory friction. For savvy investors targeting Airbnb-Optimized Holiday Homes in Brazil’s Secondary Cities: Yield Strategies for 2026 International Investors, the current currency environment combined with explosive demand growth presents a rare convergence of favorable conditions.
The numbers tell a compelling story: secondary markets like Itanhaém and Peruíbe are generating yields approaching 15%, while emerging destinations such as Gramado show 36.7% revenue growth despite controlled supply increases[1]. Meanwhile, Brazil maintains a consistently low regulatory burden across virtually all secondary markets, creating an investor-friendly environment that stands in stark contrast to increasingly restrictive jurisdictions worldwide[2].
Key Takeaways
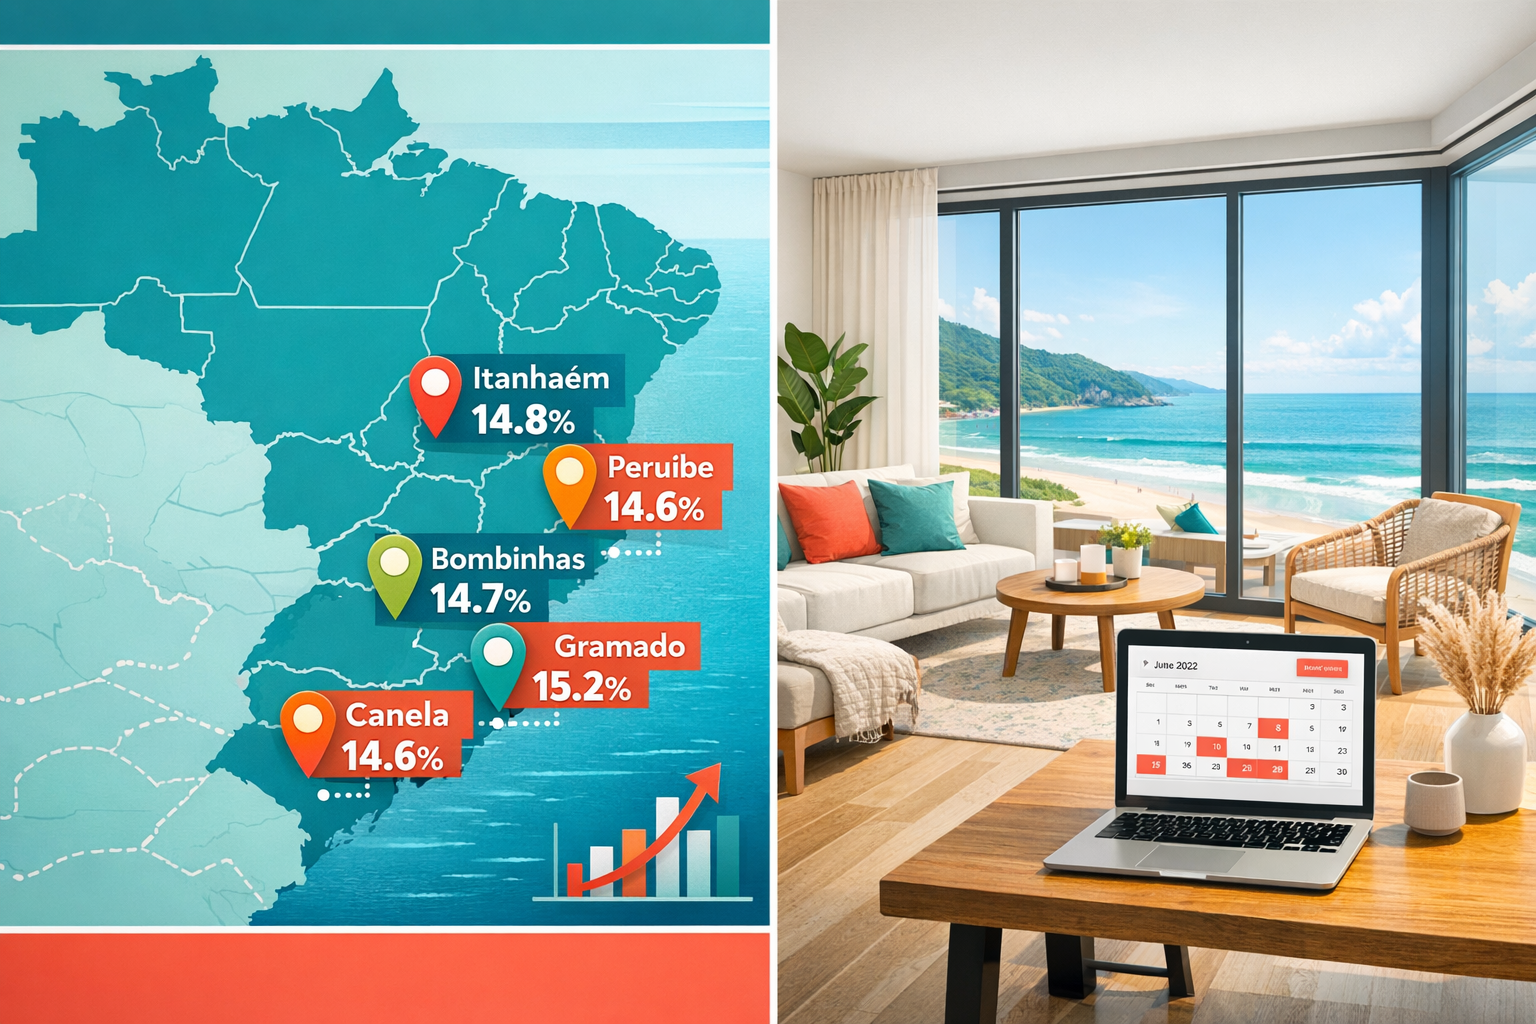
- 🏖️ Secondary coastal cities like Itanhaém (14.8% yield) and Peruíbe (14.6% yield) deliver returns nearly double those of primary markets, with entry prices around R$306,600[1]
- 📈 Hidden growth markets including Gramado, Bombinhas, and Canela show 30%+ revenue growth with controlled supply expansion, signaling strong demand fundamentals[1]
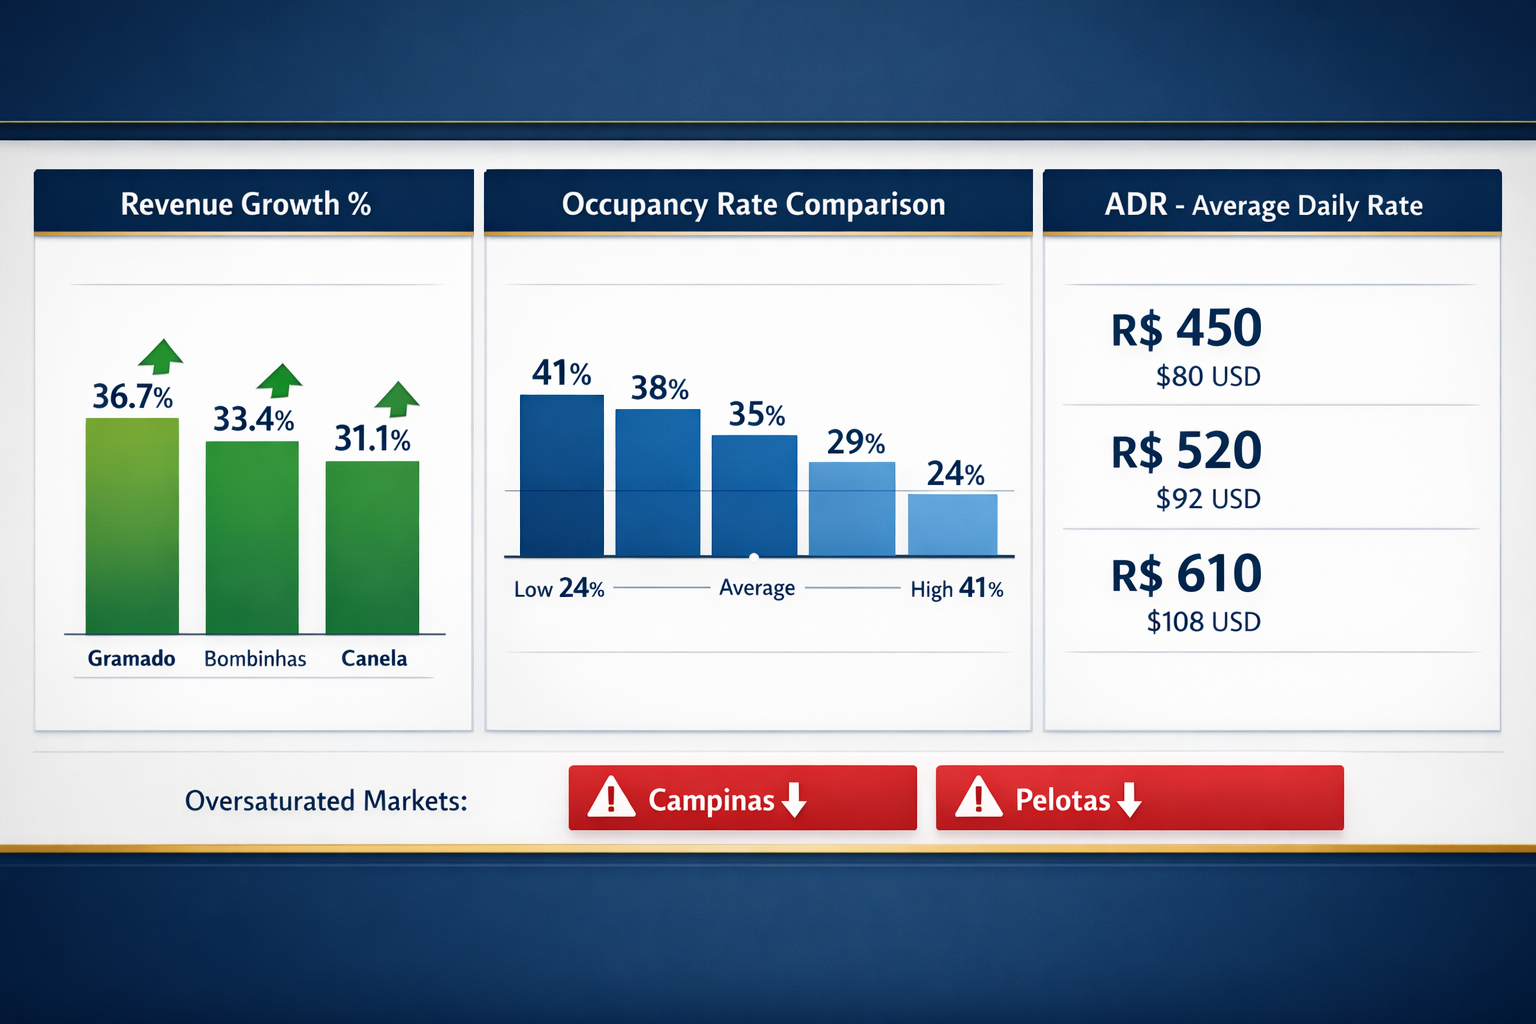
- ⚠️ Market saturation warnings emerge in Campinas and Pelotas, where supply growth dramatically outpaces revenue, requiring careful due diligence[1]
- 🔓 100% of secondary markets maintain “Low” regulatory classification, providing international investors significant operational freedom[2]
- 💼 Professional management quality represents the single largest factor driving occupancy differences, giving foreign investors with systematic approaches a competitive edge[3]
Understanding the Secondary City Opportunity in Brazil’s Airbnb Market
What Defines a Secondary City Investment Target?
Secondary cities in Brazil’s vacation rental context represent markets outside the top-tier metropolitan areas of São Paulo, Rio de Janeiro, Brasília, and primary tourist destinations like Florianópolis. These locations typically feature populations between 50,000 and 500,000 residents, strong seasonal tourism patterns, and developing infrastructure that attracts domestic and increasingly international visitors.
The appeal lies in their combination of affordability and yield potential. While primary markets command higher absolute property values, secondary cities offer superior cash-on-cash returns due to lower acquisition costs paired with robust rental demand. For international investors exploring investment opportunities across Brazil’s property landscape, these markets represent the sweet spot of risk-adjusted returns.
The Currency Advantage: BRL Weakness as Strategic Entry Point
The Brazilian Real’s depreciation against major currencies has fundamentally altered the investment equation for dollar, euro, and pound-based investors. Property acquisition costs in Real terms remain relatively stable or grow modestly, but when converted to foreign currencies, the effective purchase price has declined significantly compared to 2021-2022 levels.
This currency dynamic creates a dual benefit scenario: international investors acquire assets at favorable exchange rates while generating rental income that, when converted back to stronger currencies, provides enhanced returns. The strategy becomes particularly powerful in secondary cities where property prices haven’t yet reflected the full tourism demand recovery.
Market Segmentation: Coastal vs. Interior Lifestyle Destinations
Brazil’s secondary city opportunities divide into two distinct categories, each with unique characteristics:
Coastal Secondary Markets include destinations like Itanhaém, Peruíbe, Bombinhas, and Mata de São João. These locations benefit from:
- Strong seasonal demand during Brazilian summer (December-March)
- Weekend getaway traffic from nearby metropolitan areas
- Beach-focused amenities commanding premium rates
- International tourist appeal in select markets
Interior Lifestyle Destinations encompass mountain retreats like Gramado and Canela, wine country regions, and cultural centers like Pirenópolis. These markets offer:
- Year-round demand with less seasonal volatility
- Higher average daily rates due to unique experiences
- Growing domestic tourism from affluent Brazilian travelers
- Festival and event-driven booking patterns
Top-Performing Secondary Cities: Airbnb-Optimized Holiday Homes in Brazil’s Secondary Cities Yield Analysis
Highest Yield Markets: Itanhaém and Peruíbe Performance
The São Paulo coastal corridor presents exceptional opportunities for yield-focused investors. Itanhaém leads secondary markets with 14.8% documented yields on properties averaging R$306,600 in acquisition cost, while neighboring Peruíbe delivers 14.6% returns at similar price points[1].
These markets benefit from proximity to São Paulo’s 22 million metropolitan residents seeking weekend beach escapes. The relatively short drive (approximately 2 hours) creates consistent demand throughout the year, not just during peak summer months.
| Market | Average Yield | Typical Property Price | Distance from Major City |
|---|---|---|---|
| Itanhaém | 14.8% | R$306,600 | 2 hours from São Paulo |
| Peruíbe | 14.6% | R$306,600 | 2 hours from São Paulo |
| Mata de São João | 12-13%* | R$450,000-550,000 | 1 hour from Salvador |
*Estimated based on ADR and occupancy data[2]
The key success factor in these markets involves property selection focused on beach proximity, modern amenities, and professional presentation. Properties within 500 meters of the beach command significantly higher rates and occupancy compared to inland alternatives.
Revenue Growth Leaders: Gramado, Bombinhas, and Canela
While absolute yields matter, revenue growth trajectories indicate where momentum is building. Three secondary markets stand out for exceptional performance entering 2026:
Gramado leads with 36.7% revenue growth despite only 21.3% supply increase, indicating strong demand fundamentals absorbing new inventory[1]. This mountain resort town in Rio Grande do Sul attracts visitors year-round for its European-influenced architecture, chocolate factories, and winter festivals.
Bombinhas follows with 33.4% revenue growth against 19.3% supply expansion[1]. This Santa Catarina coastal destination offers pristine beaches and diving opportunities, attracting both domestic and international tourists seeking alternatives to more crowded beach destinations.
Canela rounds out the top three with 31.1% revenue growth and 17.8% supply growth[1]. Located near Gramado, this market benefits from similar tourism patterns while maintaining slightly lower property acquisition costs.
These growth rates significantly exceed Brazil’s inflation and GDP growth, suggesting real appreciation in rental income potential beyond currency effects. Investors considering emerging markets in the Florianópolis region should note similar dynamics at play across southern Brazil’s tourism corridor.
Premium Pricing Power: Mata de São João Case Study
Mata de São João in Bahia demonstrates how secondary markets can command primary-market pricing through differentiation. This destination achieves the highest average daily rate (ADR) of R$197.43 among tracked secondary cities, with 1,442 active properties generating average monthly revenue of $1,068.85 per listing[2].
The market’s success stems from several factors:
- Proximity to premium beaches including Praia do Forte
- Eco-tourism and resort infrastructure attracting higher-income travelers
- International tourist appeal with European and North American visitors
- Limited supply relative to demand maintaining pricing discipline
For investors, Mata de São João represents a quality-over-quantity approach. While absolute yields may not match the highest-performing markets, the combination of strong ADR, consistent occupancy, and property appreciation potential creates compelling total return profiles.
Markets Showing Warning Signs: Saturation Indicators
Not all secondary cities present equal opportunities. Early saturation signals have emerged in markets where supply growth dramatically outpaced revenue expansion:
Campinas experienced 52.6% supply growth but only 4.2% revenue growth, indicating severe oversupply conditions entering 2026[1]. Despite showing 40.82% occupancy rates (highest among secondary markets), the flood of new inventory has compressed pricing power[2].
Pelotas presents an even more concerning profile with 47.7% supply growth paired with -1.4% revenue decline[1]. This market demonstrates how uncontrolled inventory expansion can overwhelm demand, creating negative returns for investors entering at peak supply.
These cautionary examples underscore the importance of supply-demand analysis beyond simple yield calculations. Markets with explosive supply growth require evidence of proportional demand increases to justify investment.
Operational Strategies for Airbnb-Optimized Holiday Homes in Brazil’s Secondary Cities
The Host Quality Advantage: Response Time and Reviews
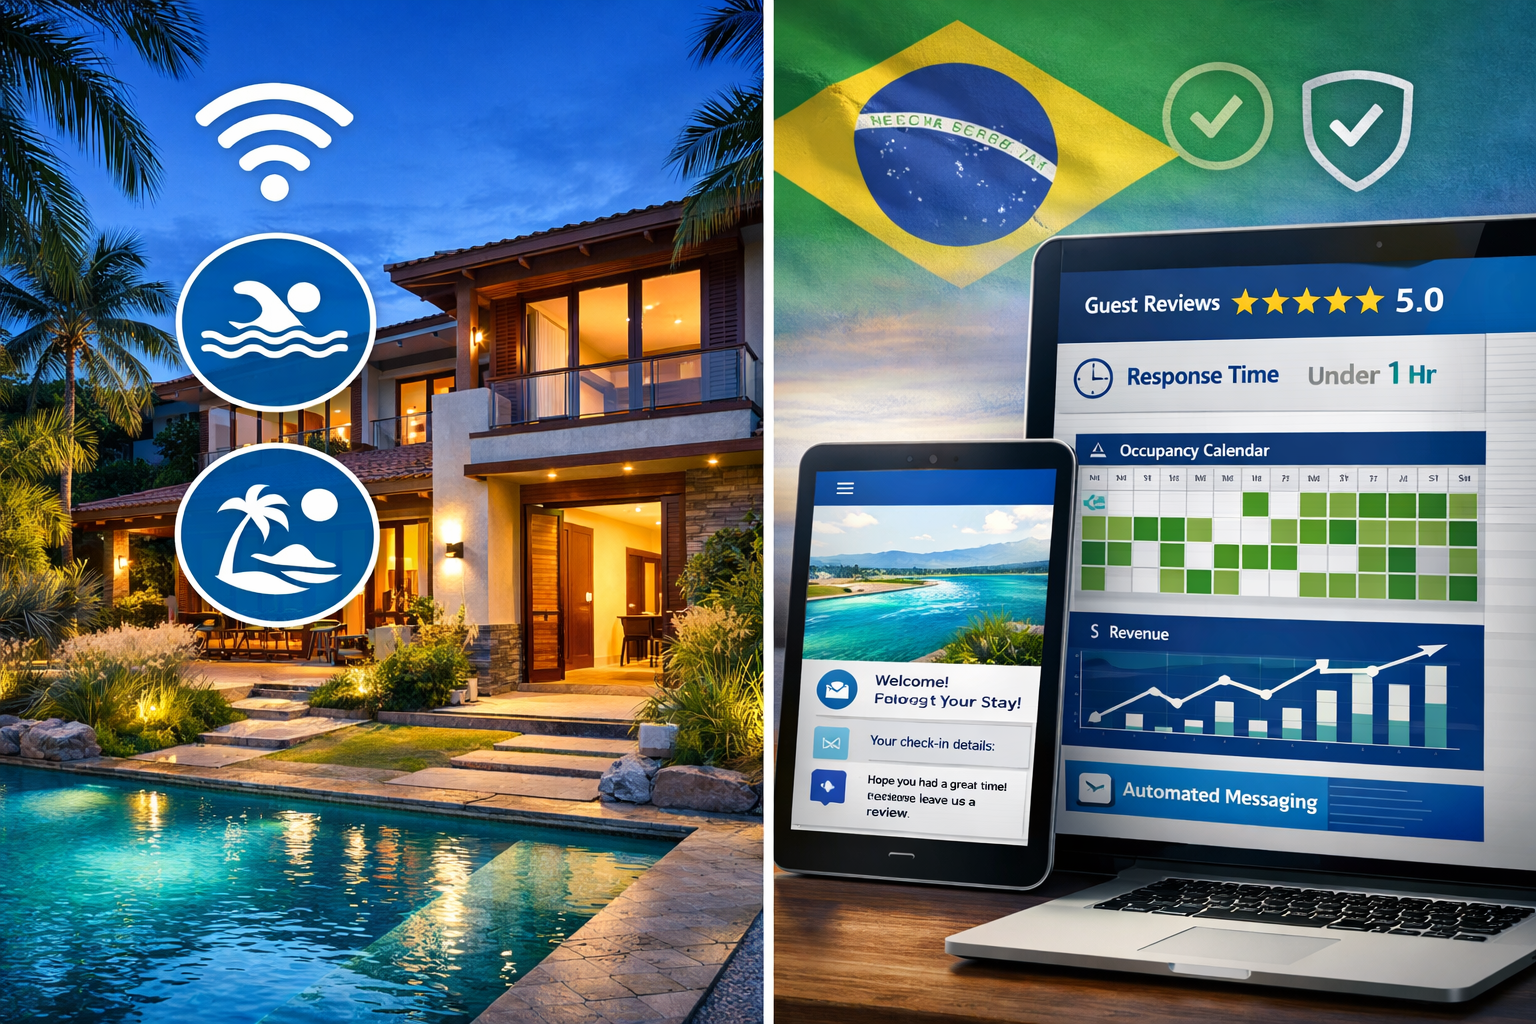
Research consistently identifies host quality metrics as the dominant factor differentiating high-performing properties from average listings. Guest reviews and response time represent the largest algorithmic factors driving visibility and bookings across all Brazilian markets[3].
For international investors, this creates a competitive advantage opportunity. Many local hosts operate informally without systematic guest communication, professional photography, or optimized pricing strategies. Investors implementing professional management standards can achieve occupancy rates 10-15 percentage points above market averages.
Key operational elements include:
- ✅ Response time under 1 hour for all inquiries (automated systems help)
- ✅ Professional photography with 20+ high-quality images
- ✅ Detailed listing descriptions in Portuguese and English
- ✅ Proactive guest communication before, during, and after stays
- ✅ Systematic review solicitation to build rating velocity
Secondary markets show occupancy variance from 24.33% to 40.82%[2], with host quality explaining much of this spread. Properties with 4.8+ ratings and 50+ reviews consistently outperform newer or lower-rated alternatives by 20-30% in revenue.
Dynamic Pricing Strategies: ADR Optimization
Average daily rate (ADR) management represents the second critical lever for yield optimization. Secondary markets show substantial pricing variation, with properties ranging from R$122.51 to R$197.43 ADR depending on location and positioning[2].
Pirenópolis demonstrates effective premium pricing, achieving $848.27 monthly revenue despite only 27.79% occupancy through its R$122.51 ADR strategy[2]. Meanwhile, Tamandaré generates similar monthly revenue ($829.95) with comparable occupancy but through higher nightly rates of R$141.81[2].
Effective pricing strategies for secondary markets include:
- Seasonal rate calendars with 3-4 distinct pricing tiers
- Weekend premiums of 30-50% over weekday rates
- Minimum stay requirements during peak periods (3-7 nights)
- Last-minute discounts to fill gaps within 7 days
- Long-stay discounts for monthly bookings (10-20% reduction)
Professional revenue management software can automate these adjustments, though investors should monitor performance monthly and adjust base rates quarterly based on market conditions.
Property Selection Criteria: Maximizing Appeal
Not all properties within secondary markets perform equally. Strategic acquisition criteria separate high-performers from underperformers:
Location Factors:
- Beach/attraction proximity (under 500m commands 25%+ premium)
- Walkability to restaurants and amenities
- Parking availability (essential in car-dependent markets)
- Neighborhood safety and aesthetics
Property Characteristics:
- 2-3 bedroom configurations show strongest demand
- Modern kitchens and bathrooms justify higher rates
- Outdoor space (balcony, terrace, or yard) increases bookings
- Pool access (private or shared) commands 15-30% ADR premium
Amenity Packages:
- High-speed WiFi (non-negotiable for remote workers)
- Air conditioning (essential in coastal markets)
- Smart TV with streaming services
- Beach equipment (chairs, umbrellas, coolers)
- Washer/dryer for longer stays
Investors exploring studio and compact property opportunities should note that secondary vacation markets favor larger units accommodating families and groups over efficiency studios.
Management Models: Local vs. Remote Operations
International investors face critical decisions regarding property management structure. Three primary models dominate:
Full-Service Local Management (25-35% of revenue):
- Complete turnkey operation including cleaning, maintenance, guest communication
- Highest cost but lowest investor time commitment
- Quality varies significantly—due diligence essential
- Best for investors with multiple properties or limited Portuguese
Hybrid Model (15-20% of revenue):
- Local cleaning and maintenance team
- Investor or VA handles guest communication and pricing
- Moderate cost with greater control
- Requires some operational involvement
Self-Management with Local Support (10-15% of revenue):
- Investor manages bookings, pricing, and communication
- Local contractor handles cleaning and emergency issues
- Lowest cost but highest time commitment
- Feasible with automation tools and Portuguese capability
The regulatory environment in Brazilian secondary markets supports all three models, with 100% of analyzed markets showing “Low” regulation classification[2]. This contrasts sharply with markets like São Paulo or Rio, where registration requirements and restrictions create compliance complexity.
Risk Mitigation and Due Diligence for International Investors
Currency Risk Management Strategies
While BRL weakness creates entry opportunities, currency volatility represents ongoing risk for international investors. Several strategies help manage exposure:
Natural Hedging:
- Finance properties in Brazilian Reals (if possible) to match revenue currency
- Maintain operating reserves in BRL to avoid conversion losses
- Time repatriation during favorable exchange rate periods
Revenue Diversification:
- Target properties attracting international guests (payment in USD/EUR)
- List on platforms with multi-currency pricing
- Consider corporate rental contracts in foreign currencies
Financial Instruments:
- Currency forward contracts for planned repatriation
- Options strategies for downside protection
- Diversification across multiple emerging market currencies
For investors with cryptocurrency exposure, Brazil’s growing crypto adoption creates alternative repatriation channels, though regulatory frameworks continue evolving.
Legal Structure and Tax Optimization
International investors should establish appropriate legal structures before acquiring Brazilian property:
Common Structures:
- Direct individual ownership (simplest but least tax-efficient)
- Brazilian LLC (Limitada) for multiple properties
- Offshore holding company with Brazilian subsidiary (complex but optimized)
Tax Considerations:
- Rental income taxed at progressive rates (15-27.5%)
- Capital gains on property sales (15% for individuals)
- Withholding taxes on international transfers (varies by structure)
- Property transfer taxes (ITBI) at 2-4% of transaction value
Professional tax and legal advice becomes essential given Brazil’s complex regulatory environment. Costs for proper structuring typically range from $3,000-$8,000 but generate ongoing savings that justify the investment.
Market Selection Framework: Avoiding Oversupply Traps
Systematic market evaluation prevents investment in saturating markets. Apply this decision framework:
Green Light Indicators:
- Revenue growth exceeding supply growth by 10+ percentage points
- Occupancy rates above 35% with room for improvement
- ADR growth tracking inflation or better
- Diversified demand sources (not single-event dependent)
- Infrastructure investment announcements (airports, roads)
Yellow Light Indicators:
- Supply growth within 5 points of revenue growth
- Occupancy rates 30-35% with competitive intensity
- Flat ADR performance
- Heavy concentration of new construction permits
Red Light Indicators:
- Supply growth exceeding revenue growth
- Declining occupancy rates or negative revenue growth
- Multiple quarters of ADR compression
- Regulatory changes under consideration
Markets like Belém showing 100.1% supply growth with 29.1% revenue growth[1] require careful analysis—while growth appears strong, sustainability questions emerge given the dramatic inventory expansion.
Building Local Networks and Support Systems
Success in secondary markets requires reliable local partnerships:
Essential Relationships:
- Property manager or management company
- Cleaning service with backup options
- Maintenance contractor (handyman, plumber, electrician)
- Legal counsel familiar with vacation rental regulations
- Accountant experienced with foreign investor taxation
Community Integration:
- Join local tourism associations
- Participate in host communities (online and in-person)
- Build relationships with neighboring property owners
- Engage with municipal tourism offices
These networks provide early warning systems for regulatory changes, market shifts, and operational challenges while creating referral opportunities and shared resource access.
Future Outlook: Airbnb-Optimized Holiday Homes in Brazil’s Secondary Cities Through 2028
Emerging Markets to Watch
Several secondary cities show early-stage growth indicators suggesting strong performance potential through 2028:
Belém (Pará state) demonstrates explosive growth with 100.1% supply expansion paired with 29.1% revenue growth[1]. As Amazon tourism develops and infrastructure improves, this market may transition from emerging to established status.
Ribeirão Preto (São Paulo interior) shows 33.8% supply growth with 29.0% revenue growth[1], indicating strong demand fundamentals in this agricultural and business hub attracting corporate travelers and weekend tourists.
Coastal Bahia markets beyond Mata de São João present opportunities as international tourism returns to pre-pandemic levels and Brazilian domestic travel continues expanding.
Investors should monitor these markets quarterly, watching for stabilization of supply-demand ratios that signal appropriate entry timing.
Infrastructure and Connectivity Improvements
Government infrastructure investment creates secondary market catalysts:
- Airport expansions in secondary cities reduce travel friction
- Highway improvements decrease drive times from major metropolitan areas
- Broadband deployment enables remote work tourism
- Port development in coastal markets attracts cruise tourism
These infrastructure improvements typically precede property value appreciation by 12-24 months, creating advance positioning opportunities for informed investors.
Regulatory Trajectory and Compliance Outlook
Brazil’s consistently low regulatory burden across secondary markets represents a significant competitive advantage compared to increasingly restrictive jurisdictions worldwide[2]. However, investors should anticipate gradual regulatory evolution:
Likely Developments:
- Formalization of registration requirements (currently minimal)
- Tax collection mechanisms through platforms (already partially implemented)
- Occupancy limits in specific high-density areas
- Safety and quality standards for commercial operators
These changes generally favor professional investors over informal hosts, as compliance capabilities become competitive advantages. The trajectory suggests increasing professionalization rather than restrictive limitations.
Sustainability and Eco-Tourism Trends
Growing environmental consciousness among travelers creates differentiation opportunities:
- Eco-certified properties command 10-15% ADR premiums
- Solar power and water conservation reduce operating costs
- Sustainable tourism certifications increase visibility
- Local experience integration attracts conscious travelers
Secondary markets with natural assets (beaches, forests, wildlife) benefit disproportionately from these trends. Properties positioned around eco-tourism themes can achieve both higher returns and greater resilience against commodity vacation rental competition.
Conclusion
Airbnb-Optimized Holiday Homes in Brazil’s Secondary Cities: Yield Strategies for 2026 International Investors represent one of the most compelling risk-adjusted return opportunities in global vacation rental markets. The convergence of favorable currency dynamics, consistently low regulatory burden, explosive demand growth in select markets, and professional management gaps creates conditions rarely seen in mature markets.
The data reveals clear winners: Itanhaém and Peruíbe deliver near-15% yields with accessible entry prices, while Gramado, Bombinhas, and Canela show 30%+ revenue growth with controlled supply expansion[1]. These markets demonstrate sustainable fundamentals rather than speculative bubbles.
However, success requires systematic approach and careful market selection. Warning signs in Campinas and Pelotas demonstrate how oversupply can quickly erode returns[1]. The 16-point occupancy variance across secondary markets[2] underscores the importance of operational excellence, particularly host quality metrics that drive algorithmic visibility[3].
Actionable Next Steps for International Investors
- Conduct market analysis using the framework provided, focusing on revenue-to-supply growth ratios
- Establish legal and tax structure with Brazilian legal counsel before property search
- Build local network of property managers, service providers, and fellow investors
- Start with single property in proven market (Itanhaém, Gramado, or Mata de São João) to learn operations
- Implement professional standards from day one: quality photography, rapid response times, dynamic pricing
- Monitor performance monthly and adjust strategies based on actual data
- Scale systematically once first property achieves target returns and operational efficiency
The opportunity window remains open in early 2026, but market dynamics shift quickly. Secondary cities showing strong fundamentals today may face saturation within 18-24 months as word spreads and supply responds. For investors willing to navigate Brazil’s complexity with professional guidance, the current environment offers exceptional potential for building cash-flowing vacation rental portfolios delivering returns difficult to replicate in developed markets.
Those interested in exploring specific opportunities should consider reviewing current development projects and understanding regional market dynamics that influence secondary city performance across Brazil’s diverse geography.
References
[1] Best Airbnb Markets Brazil – https://airbtics.com/best-airbnb-markets-brazil
[2] Brazil – https://www.airroi.com/report/world/brazil
[3] Brazil Airbnb – https://thelatinvestor.com/blogs/news/brazil-airbnb