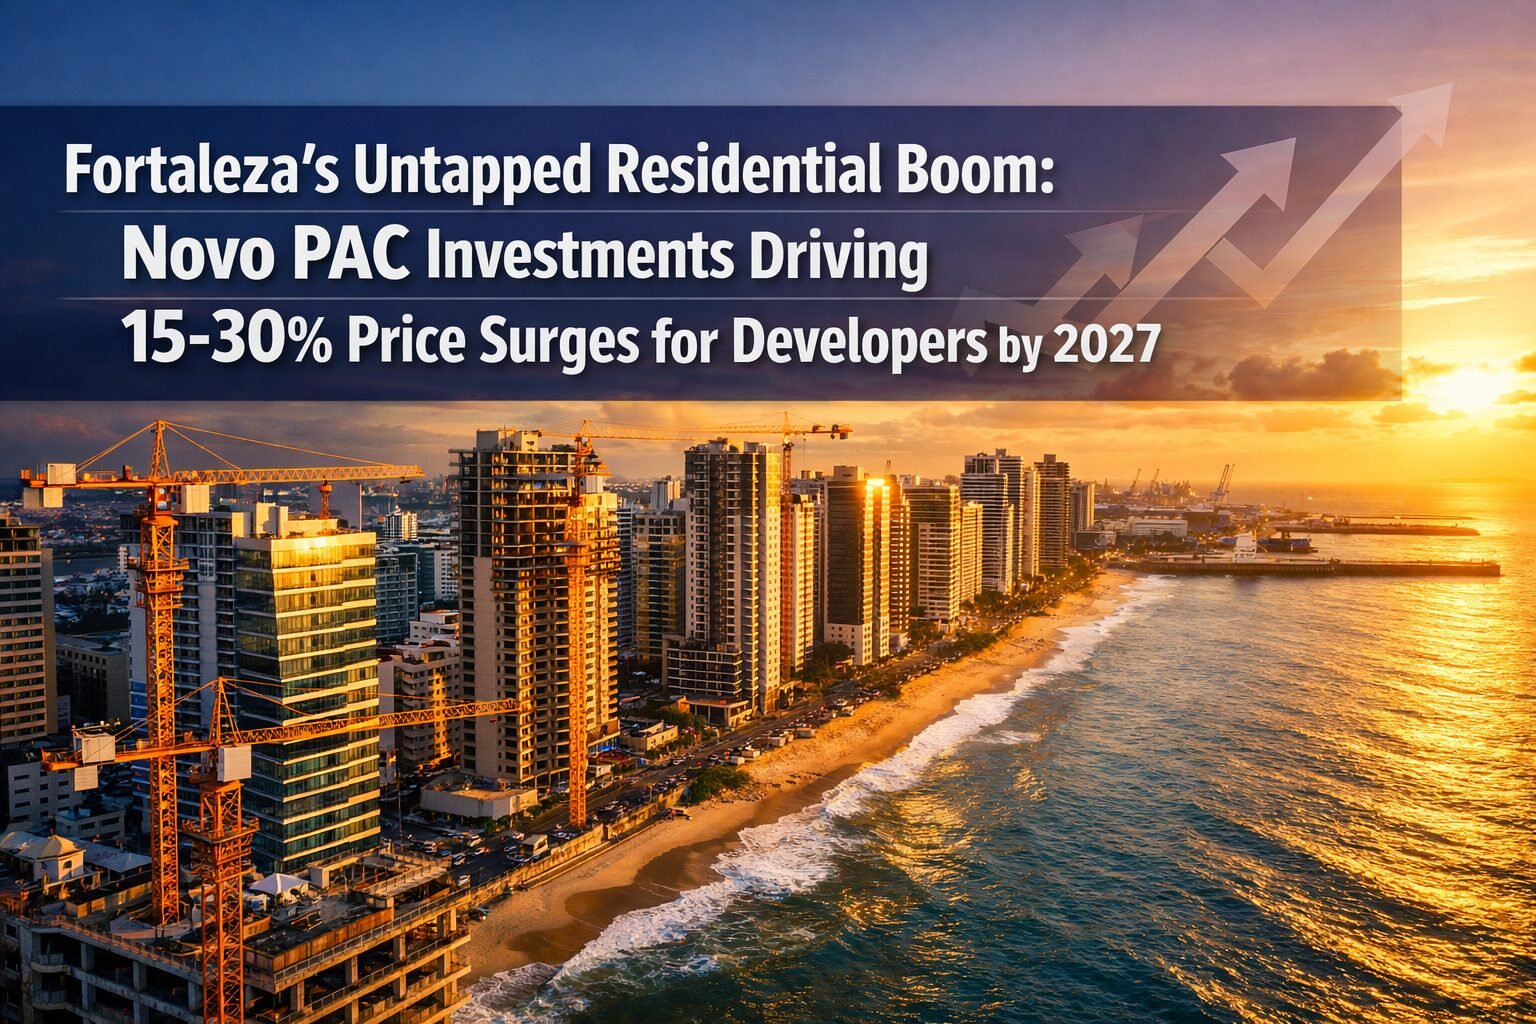
While João Pessoa dominates headlines as Brazil’s emerging real estate darling, a quieter revolution is unfolding 500 kilometers west along the Atlantic coast. Fortaleza, the capital of Ceará state, is experiencing a residential transformation that savvy mid-sized developers are beginning to recognize as the next major opportunity in Brazil’s secondary city market. With port expansions, transit upgrades, and infrastructure investments flowing through the Novo PAC (Growth Acceleration Program), Fortaleza’s Untapped Residential Boom: Novo PAC Investments Driving 15-30% Price Surges for Developers by 2027 represents a compelling thesis for developers seeking lower entry barriers and higher growth potential before market saturation sets in.
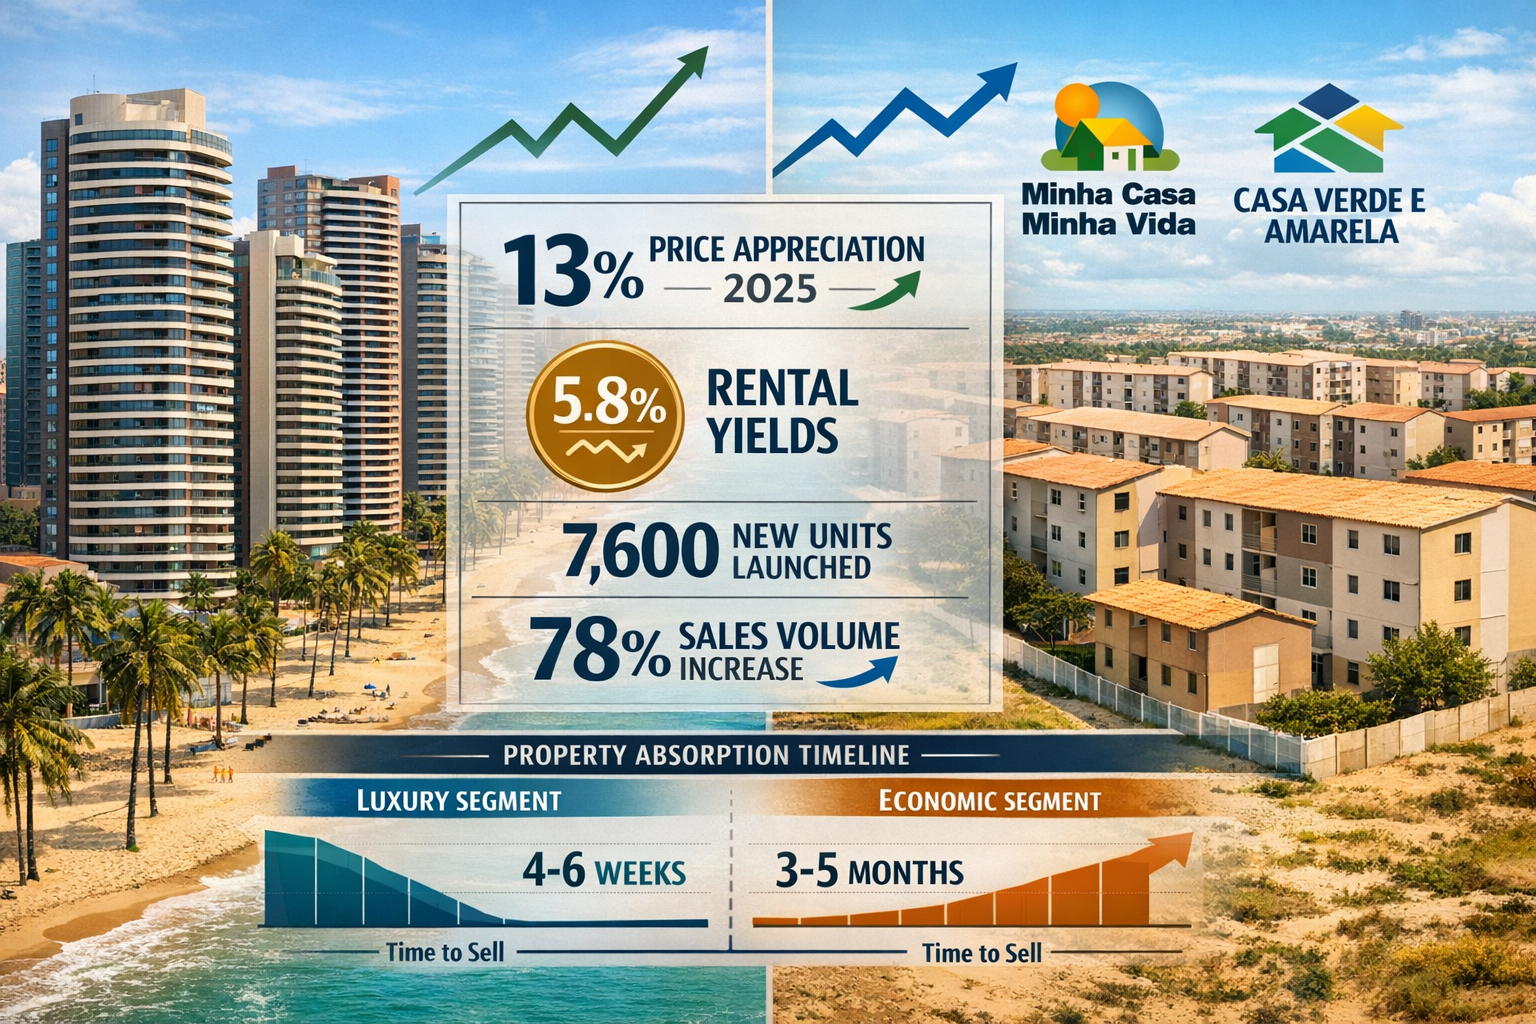
The numbers tell a compelling story: 13% price appreciation in 2025 alone, rental demand surging nearly 12% year-over-year, and sales volumes jumping 78% in early 2024[1]. These aren’t the metrics of a speculative bubble—they reflect genuine demand fundamentals in a city that’s still flying under the radar of major institutional capital.
Key Takeaways
✅ Double-Digit Growth Trajectory: Fortaleza recorded 13% price appreciation in 2025, significantly outpacing most Brazilian capitals, with projections pointing to 10-15% nominal growth through 2026-2027 if favorable conditions persist[1].
✅ Infrastructure Catalyst: Novo PAC investments in port expansion, metro extensions, and highway corridors are creating new value corridors before widespread market recognition.
✅ Supply-Demand Imbalance: With 7,600 new units launched in 2023 against a metropolitan population growing toward 4.5 million by 2035, absorption rates remain strong—well-priced properties sell within weeks[1][2].
✅ Superior Yield Profile: Average gross rental yields of 5.8% exceed Brazilian averages, providing developers with compelling value propositions for both end-users and investors[2].
✅ Strategic Window Closing: Current market conditions favor selective buyers and developers willing to negotiate, but the “warm but not bubble-level” pricing environment won’t last as institutional capital discovers the opportunity[1].
Understanding Fortaleza’s Market Position in Brazil’s Secondary City Landscape
Why Fortaleza Deserves Developer Attention Now
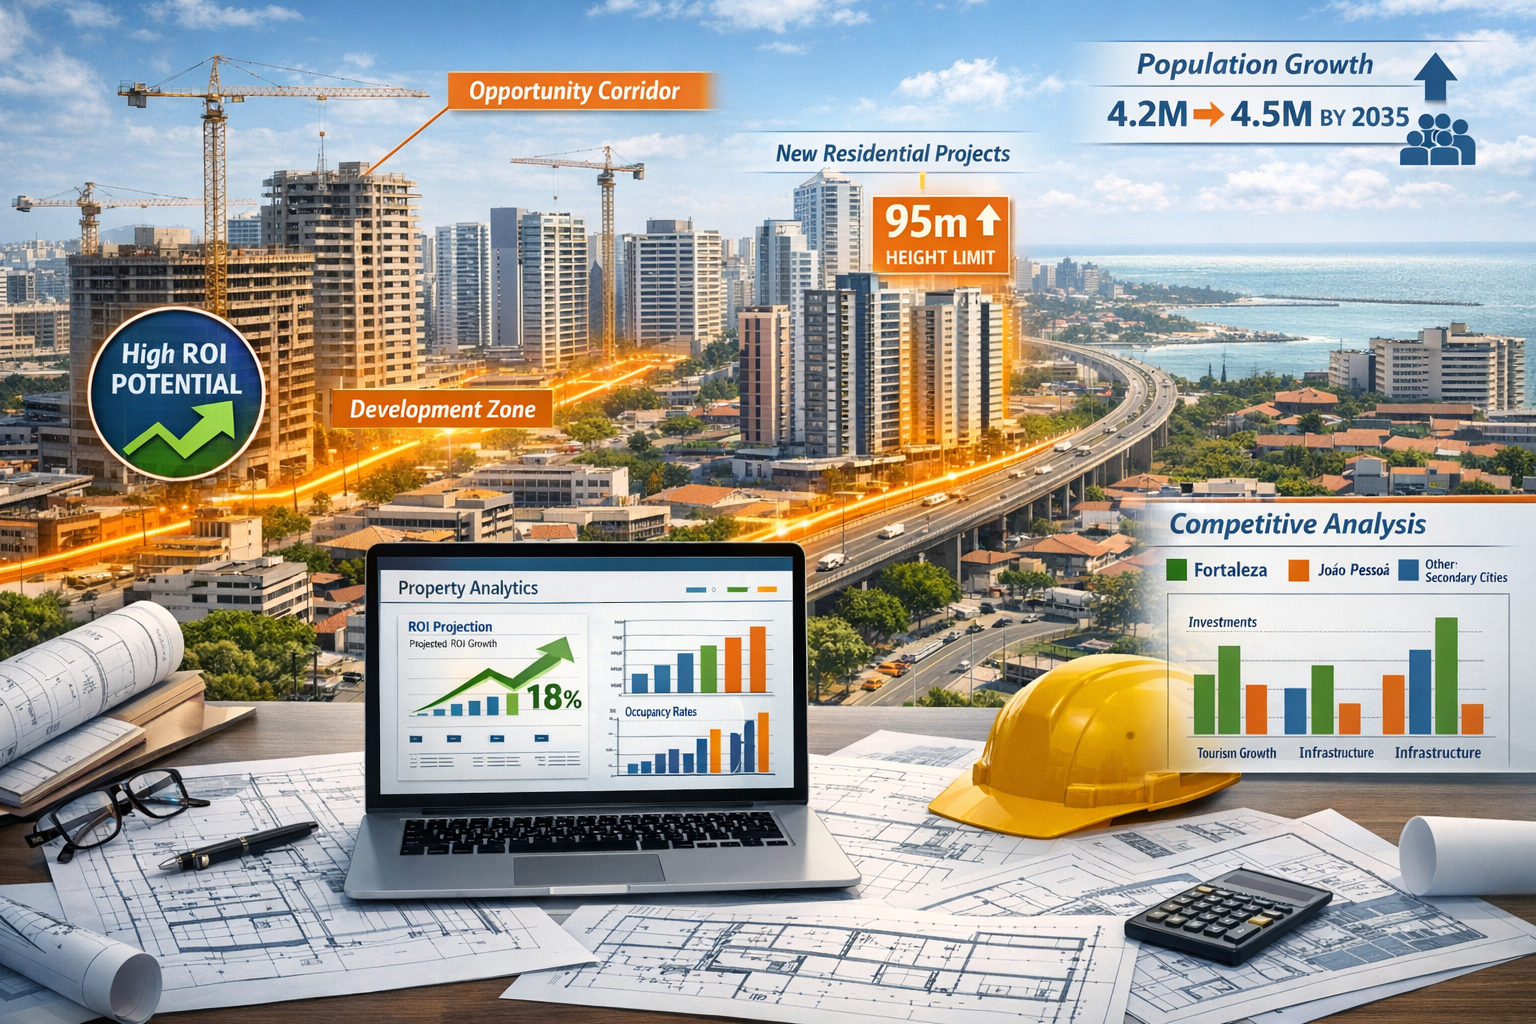
Brazil’s real estate market has long been dominated by the São Paulo-Rio de Janeiro axis, with secondary cities like Florianópolis and João Pessoa capturing attention from sophisticated developers in recent years. However, Fortaleza’s unique combination of scale, growth fundamentals, and infrastructure investment creates a distinct opportunity profile.
The metropolitan area houses over 4.2 million inhabitants with projections indicating approximately 300,000 additional residents by 2035[2]. This population base provides the critical mass necessary for sustained residential demand while remaining accessible to mid-sized developers who would struggle to compete in saturated major markets.
Unlike purely tourism-driven markets, Fortaleza benefits from a diversified economic base including:
- 🏭 Industrial and manufacturing sectors supported by port infrastructure
- 💼 Growing service economy with expanding middle-class employment
- 🎓 Education and healthcare hubs attracting regional migration
- ✈️ Tourism and hospitality providing rental demand stability
This economic diversity creates resilience that pure beach resort markets lack, making it an attractive location for developers seeking sustainable investment opportunities in Brazil’s property market.
Comparative Analysis: Fortaleza vs. Other Secondary Markets
| Market | 2025 Price Growth | Avg. Rental Yield | Population (Metro) | Developer Competition |
|---|---|---|---|---|
| Fortaleza | 13%[1] | 5.8%[2] | 4.2M | Moderate |
| João Pessoa | 15-18% | 5.2% | 1.2M | High |
| Florianópolis | 10-12% | 4.8% | 1.1M | Very High |
| Natal | 8-10% | 5.5% | 1.6M | Low-Moderate |
| Recife | 7-9% | 5.0% | 4.0M | Moderate-High |
The data reveals Fortaleza’s sweet spot positioning: strong growth comparable to João Pessoa, superior yields to most competitors, and significantly larger population base providing demand depth—all while maintaining moderate competition levels that allow nimble developers to secure prime sites.
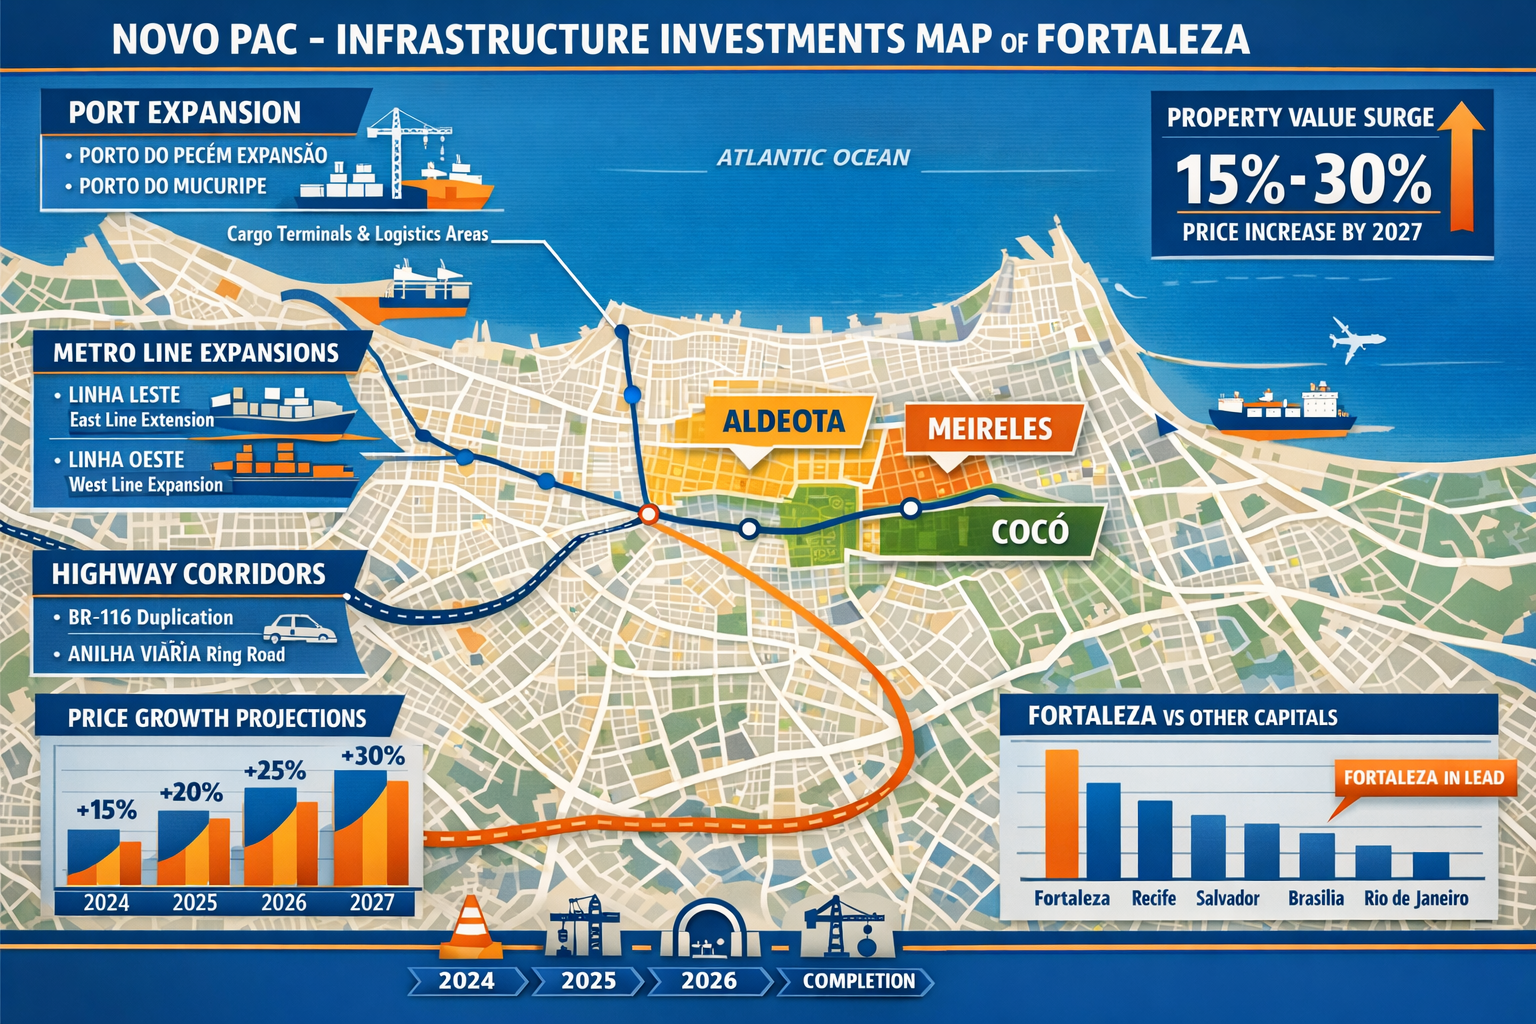
Novo PAC Infrastructure Investments: The Growth Catalyst Behind Fortaleza’s Untapped Residential Boom
Decoding the Novo PAC Impact on Residential Values
The Novo PAC (New Growth Acceleration Program) represents Brazil’s renewed commitment to infrastructure development, with Fortaleza receiving substantial allocations across multiple categories. For developers, understanding which infrastructure projects create the most significant residential value uplift is crucial to site selection and project positioning.
Port of Pecém Expansion 🚢
Located 60 kilometers from downtown Fortaleza, the Port of Pecém expansion under Novo PAC includes:
- Deepwater berth construction enabling larger vessels
- Industrial zone development creating employment corridors
- Logistics hub improvements connecting port to highway networks
Developer Implication: The corridor between Fortaleza and Pecém is experiencing industrial employment growth, creating demand for workforce housing in previously overlooked municipalities. Mid-sized developers can acquire land at significant discounts to central Fortaleza while capturing appreciation as the corridor develops.
Metro Line Extensions 🚇
Fortaleza’s metro system, while limited compared to São Paulo or Rio, is expanding under Novo PAC with:
- Line extensions reaching previously underserved neighborhoods
- Station area development plans encouraging mixed-use projects
- Integration with bus rapid transit (BRT) networks
Properties within 800 meters of new metro stations historically appreciate 20-35% faster than comparable units in non-transit-oriented locations. Developers who secure sites near planned stations before completion can capture this premium.
Highway Corridor Improvements 🛣️
Novo PAC funding is upgrading key highway corridors including:
- CE-040 coastal highway improvements
- BR-116 expansion connecting Fortaleza to southern markets
- Ring road completion reducing downtown congestion
These improvements reduce commute times from peripheral neighborhoods to employment centers, making previously marginal locations viable for residential development.
Mapping the Value Corridors: Where to Deploy Capital
Based on Novo PAC project locations and historical infrastructure impact patterns, three primary value corridors emerge for developer focus:
1. Aldeota-Meireles Vertical Intensification Zone
New zoning rules permit heights up to 95 meters in consolidated neighborhoods like Aldeota, Meireles, and Varjota[1]. This regulatory shift, combined with these areas’ established desirability, creates opportunities for:
- Land assembly and redevelopment of older low-rise buildings
- Premium product positioning for upper-middle-class buyers
- Mixed-use projects capturing retail and residential demand
Challenge: Higher land costs require sophisticated financial engineering and faster sales velocity to achieve target returns.
2. Cocó-Dunas Expansion Corridor
The Cocó neighborhood and surrounding areas benefit from:
- Proximity to Cocó Ecological Park (largest urban park in Latin America)
- Metro accessibility improvements
- Growing middle-class demand for quality housing
Opportunity: Mid-market product (R$300,000-R$600,000 units) targeting young professionals and growing families. Well-priced properties in Cocó sell within weeks rather than months[1], indicating strong absorption potential.
3. Pecém Industrial Corridor Economic Housing
The stretch between Fortaleza and the Port of Pecém represents the highest-risk, highest-potential opportunity:
- Land costs 60-70% below central Fortaleza
- Federal economic housing program support (Minha Casa Minha Vida)
- Industrial employment growth creating demand base
Developers launched approximately 4,700 units in the “economic” segment supported by federal programs in 2023[2], demonstrating both demand and program viability. For developers experienced in navigating federal program requirements, this corridor offers volume-based returns with lower per-unit margins but faster turnover.
Exploring opportunities across different development segments can help developers identify the right fit for their capital and expertise.
Market Fundamentals Supporting 15-30% Price Surges Through 2027
Demand Drivers: Beyond Speculation to Structural Growth
Understanding whether price appreciation reflects genuine demand or speculative froth is critical for developers planning multi-year projects. Several indicators suggest Fortaleza’s growth rests on solid fundamentals:
Rental Market Strength 📈
Rents rose nearly 12% over the past 12 months[1], nearly matching price appreciation. This parallel movement indicates:
- Tenants competing for limited inventory (genuine occupancy demand)
- Landlords exercising pricing power (tight market conditions)
- Investment purchases generating actual rental income (not speculation)
When rental growth tracks price growth, it suggests valuations remain tethered to income-generating potential rather than pure capital appreciation expectations.
Sales Velocity and Absorption ⚡
Sales volumes jumped 78% in early 2024[1], with strong ongoing absorption suggesting inventory remains tight relative to buyer demand. Well-priced properties in desirable neighborhoods sell within weeks rather than months, while even overpriced or less desirable units move within 90-120 days[1].
For developers, these absorption rates indicate:
- Construction-to-sales cycles can be compressed
- Pre-sales velocity supports construction financing
- Market can absorb new supply without price deterioration
Population Growth and Demographic Trends 👥
The metropolitan area’s projected addition of 300,000 residents by 2035[2] translates to approximately 25,000 new residents annually. Assuming average household size of 3.2 persons, this creates demand for roughly 7,800 new housing units per year from population growth alone.
With developers launching 7,600 units in 2023[2], supply roughly matches demographic-driven demand—before accounting for:
- Replacement of obsolete housing stock
- Household formation from existing population
- Migration from rural Ceará to metropolitan Fortaleza
This supply-demand balance suggests the market can sustain current launch volumes without oversupply risk, while also indicating room for expansion as infrastructure improvements unlock new demand.
Price Projection Methodology: The 15-30% Surge Thesis
The projection of 15-30% price surges for developers by 2027 rests on multiple scenario assumptions:
Conservative Scenario (15% by 2027) 📊
- Annual appreciation of approximately 7-8% (2026-2027)
- Assumes interest rate environment remains elevated
- Limited institutional capital entry
- Infrastructure projects experience typical Brazilian delays
- Economic growth remains modest (2-3% GDP)
This scenario still outpaces inflation and provides attractive returns for developers acquiring land at current prices and delivering units in 2027.
Base Case Scenario (20-23% by 2027) 📈
- Estimated plausible price change of 10-15% in nominal terms if interest rates fall meaningfully and sidelined buyers return[1]
- Novo PAC projects progress on schedule
- Moderate economic growth (3-4% GDP)
- Continued tight supply-demand balance
This represents the most probable outcome based on current trajectory and historical patterns.
Optimistic Scenario (25-30% by 2027) 🚀
- Accelerated infrastructure completion creating value earlier than expected
- Significant institutional capital discovery of Fortaleza opportunity
- Strong economic growth (4-5% GDP)
- Federal housing program expansion increasing accessible demand
While possible, this scenario requires multiple favorable conditions aligning simultaneously.
For context, developers who understand how buying pre-construction can amplify returns can position projects to capture maximum appreciation during the development cycle.
Risk Factors and Mitigation Strategies
No market projection is without risks. Developers should monitor and plan for:
Regulatory Risk ⚖️
Zoning changes can cut both ways. While current rules permit 95-meter heights in key neighborhoods[1], future administrations could impose restrictions. Mitigation: Secure permits and approvals early; maintain relationships with municipal planning departments; diversify across multiple neighborhoods.
Interest Rate Volatility 💰
Brazilian interest rates significantly impact mortgage affordability and buyer demand. Mitigation: Structure projects with flexible sales timelines; maintain relationships with multiple financing partners; consider offering developer financing for qualified buyers.
Infrastructure Delays 🚧
Brazilian infrastructure projects frequently experience delays and budget overruns. Mitigation: Don’t rely solely on planned infrastructure; select sites with existing infrastructure quality; build buffers into financial models for delayed value realization.
Economic Downturn 📉
Broader economic challenges could suppress demand regardless of local fundamentals. Mitigation: Maintain conservative leverage ratios; focus on mid-market segments with broader buyer pools; ensure projects pencil at lower appreciation assumptions.
Strategic Playbook for Developers: Capitalizing Before Market Saturation
Site Selection and Acquisition Strategies
Timing the Entry ⏰
Current market conditions are characterized as “rather yes” for selective buyers willing to negotiate, with prices described as “warm but not bubble-level”[1]. This represents an optimal entry window—prices have appreciated enough to confirm the trend, but not so much that early-mover advantage is lost.
Site Selection Criteria Framework:
Infrastructure Proximity Score (30% weight)
- Distance to existing or planned metro stations
- Highway access quality
- Proximity to employment centers
- Walkability to amenities
Regulatory Favorability (25% weight)
- Allowable density and height
- Permit approval timeline history
- Zoning stability (likelihood of future restrictions)
Demand Indicators (25% weight)
- Neighborhood absorption rates
- Rental yield potential
- Demographic trends (age, income)
Competitive Landscape (20% weight)
- Number of competing projects in pipeline
- Quality of existing housing stock
- Barriers to entry for new competitors
Land Assembly Tactics 🏗️
In established neighborhoods like Aldeota and Meireles where redevelopment opportunities exist:
- Target aging low-rise buildings (3-4 stories) on large lots
- Engage owners early with compelling offers before competition emerges
- Consider partnership structures with existing landowners (land-for-units swaps)
- Leverage local brokers with established relationships
In expansion corridors like the Pecém industrial zone:
- Acquire larger parcels enabling phased development
- Negotiate options on adjacent parcels for future expansion
- Verify infrastructure commitment timelines before closing
- Assess soil conditions and development costs early
Product Positioning and Segment Selection
Luxury Segment (R$800,000+) 💎
- Target Markets: Aldeota, Meireles beachfront, Varjota
- Unit Mix: 3-4 bedroom, 120-180 sqm, high-end finishes
- Buyer Profile: Established professionals, second-home buyers, investors
- Margin Profile: 25-35% gross margins, slower absorption (6-12 months)
- Risk Level: Higher sensitivity to economic conditions
Mid-Market Segment (R$300,000-R$600,000) 🏢
- Target Markets: Cocó, Aldeota periphery, Papicu
- Unit Mix: 2-3 bedroom, 60-90 sqm, quality finishes
- Buyer Profile: Young professionals, growing families, first-time buyers
- Margin Profile: 18-25% gross margins, fast absorption (3-6 months)
- Risk Level: Moderate, broad buyer pool provides stability
Economic Segment (R$150,000-R$300,000) 🏘️
- Target Markets: Pecém corridor, peripheral neighborhoods
- Unit Mix: 2 bedroom, 45-60 sqm, functional finishes
- Buyer Profile: Federal program beneficiaries, working-class families
- Margin Profile: 12-18% gross margins, very fast absorption (1-3 months)
- Risk Level: Lower price risk, higher regulatory/program risk
For developers exploring different market segments, reviewing various development projects and their positioning provides valuable competitive intelligence.
Financial Structuring and Return Optimization
Capital Stack Optimization 💵
Typical Brazilian residential development capital structure:
- Equity: 25-35% of total project cost
- Construction Financing: 50-60% (released against construction milestones)
- Pre-Sales Revenue: 15-25% (used to reduce construction financing need)
Key Metrics to Target:
- Equity Multiple: 1.8x – 2.5x over 24-36 month project lifecycle
- IRR: 25-35% (accounting for Brazilian inflation and risk)
- Debt Service Coverage: Minimum 1.3x during construction
- Pre-Sales Threshold: 30-40% before construction commencement
Revenue Acceleration Tactics ⚡
Aggressive Pre-Sales Campaigns: Launch sales 6-9 months before construction with early-bird discounts (5-8% off final pricing) to generate cash and reduce financing needs
Phased Releases: Release units in tranches as earlier tranches sell, creating scarcity perception and enabling price increases between phases
Payment Plan Flexibility: Offer extended payment terms (24-36 months) during construction to expand buyer pool, with pricing premiums offsetting time-value costs
Investor-Focused Units: Designate 20-30% of units for investor buyers with guaranteed rental yield programs (first 12-24 months), enabling bulk sales to sophisticated buyers
Partnership and Joint Venture Considerations
For mid-sized developers entering Fortaleza without established local presence:
Local Partner Value Proposition 🤝
- Land Sourcing: Established relationships with brokers and landowners
- Regulatory Navigation: Familiarity with municipal approval processes
- Contractor Networks: Vetted construction partners and subcontractors
- Sales Channels: Existing broker relationships and buyer databases
Typical JV Structure:
- Local partner: 30-40% equity for land, local expertise, and regulatory management
- External developer: 60-70% equity for capital, development expertise, and project management
- Promote structure: 70/30 split to preferred return threshold (15-18%), then 50/50 above
Red Flags in Partner Selection:
- ❌ Partners without completed projects in past 3 years
- ❌ Excessive leverage on existing projects
- ❌ Unwillingness to provide detailed financial statements
- ❌ Resistance to third-party legal and financial due diligence
Yield Forecasts and Investment Return Projections
Rental Yield Analysis Across Segments
Fortaleza’s average gross rental yields of approximately 5.8%[2] exceed Brazilian averages, but significant variation exists across property types and locations:
Beachfront Luxury (Meireles, Iracema) 🌊
- Gross Yield: 4.5-5.2%
- Occupancy: 75-85% (seasonal variation)
- Tenant Profile: Tourists, corporate relocations, affluent locals
- Management Intensity: High (furnished, short-term rentals)
Mid-Market Residential (Cocó, Aldeota) 🏙️
- Gross Yield: 5.5-6.2%
- Occupancy: 90-95%
- Tenant Profile: Young professionals, families, long-term residents
- Management Intensity: Low-moderate (unfurnished, annual leases)
Economic Housing (Peripheral Areas) 🏘️
- Gross Yield: 6.0-7.0%
- Occupancy: 95-98%
- Tenant Profile: Working-class families, federal program beneficiaries
- Management Intensity: Low (simple units, stable tenants)
Studios and Small Units 🎓
- Gross Yield: 6.5-8.0%
- Occupancy: 85-92%
- Tenant Profile: Students, young singles, temporary workers
- Management Intensity: Moderate-high (higher turnover)
Developers interested in the studio segment specifically can explore strategies for studio investments in other Brazilian markets for comparative insights.
Developer Return Scenarios: 2026-2027 Projects
Example Pro Forma: Mid-Market Project in Cocó 📊
Project Parameters:
- 80 units, 2-bedroom, 65 sqm average
- Average sale price: R$450,000 (R$6,923/sqm)
- Total revenue: R$36,000,000
- Land cost: R$4,500,000 (12.5% of revenue)
- Construction cost: R$18,000,000 (50% of revenue)
- Soft costs: R$3,600,000 (10% of revenue)
- Total project cost: R$26,100,000
Return Calculation:
- Gross profit: R$9,900,000
- Gross margin: 27.5%
- Equity invested: R$8,000,000
- Equity multiple: 1.24x
- Project duration: 30 months
- IRR: 28.3%
Appreciation Impact: If prices appreciate 20% during the 30-month development cycle (consistent with base case scenario), units initially priced at R$450,000 can be sold at R$540,000 in final phases:
- Revised total revenue: R$39,600,000
- Revised gross profit: R$13,500,000
- Revised equity multiple: 1.69x
- Revised IRR: 38.7%
This demonstrates how Fortaleza’s Untapped Residential Boom: Novo PAC Investments Driving 15-30% Price Surges for Developers by 2027 directly translates to enhanced developer returns through appreciation capture during the development cycle.
Comparative Returns: Fortaleza vs. Alternative Markets
| Market | Typical Developer IRR | Land Cost (% Revenue) | Absorption Speed | Competition Level |
|---|---|---|---|---|
| Fortaleza | 25-35% | 12-15% | Fast | Moderate |
| São Paulo | 18-25% | 20-30% | Moderate | Very High |
| Rio de Janeiro | 15-22% | 18-25% | Slow-Moderate | High |
| João Pessoa | 28-38% | 10-12% | Very Fast | High |
| Florianópolis | 22-30% | 15-22% | Fast | Very High |
Fortaleza’s combination of strong IRRs, reasonable land costs, and fast absorption with moderate competition creates an attractive risk-adjusted return profile for developers who can execute efficiently.
Navigating Challenges and Competitive Positioning
Supply Pipeline Analysis: Avoiding Oversupply Traps
While current supply-demand dynamics favor developers, monitoring the project pipeline prevents entering oversaturated submarkets.
2023 Launch Data Analysis[2]:
- Total units launched: 7,600
- Economic segment: 4,700 units (62%)
- Mid-market segment: 2,100 units (28%)
- Luxury segment: 800 units (10%)
Implications for 2026-2027 Developers:
The heavy concentration in economic segment (62% of launches) suggests potential saturation in this category, particularly in peripheral locations. Developers should:
- ✅ Favor mid-market positioning where supply remains tighter relative to demand
- ✅ Differentiate economic segment projects through superior location or amenities
- ✅ Monitor federal program funding levels as economic segment depends heavily on Minha Casa Minha Vida
The limited luxury supply (10% of launches) indicates potential opportunity, but requires careful location selection as luxury buyers concentrate in specific neighborhoods.
Regulatory Navigation and Approval Timelines
Brazilian real estate development faces significant regulatory complexity. Fortaleza-specific considerations include:
Zoning and Height Restrictions 📏
- Consolidated neighborhoods (Aldeota, Meireles, Varjota): Up to 95 meters permitted[1]
- Protected social interest zones: Limited to approximately 6 meters[1]
- Transitional areas: Variable restrictions requiring case-by-case analysis
Strategy: Engage urban planning consultants early to verify zoning classification and identify any pending regulatory changes that could impact approvals.
Environmental Licensing 🌿
Coastal projects face additional environmental review requirements:
- Coastal zone management compliance
- Environmental impact assessments for larger projects
- Protected area buffer zone restrictions
Timeline: Environmental approvals can add 4-8 months to project timelines; initiate early and maintain proactive communication with environmental agencies.
Municipal Approval Process 🏛️
Typical timeline for project approvals in Fortaleza:
- Preliminary consultation: 1-2 months
- Project submission: 2-3 months for initial review
- Revisions and resubmission: 1-2 months (may require multiple cycles)
- Final approval: 1-2 months
- Total: 5-9 months for straightforward projects
Acceleration tactics:
- Hire architects with established municipal relationships
- Submit complete, high-quality applications minimizing revision cycles
- Maintain regular communication with reviewing departments
- Consider pre-application meetings to identify potential issues
Competitive Differentiation Strategies
As more developers discover Fortaleza’s opportunity, differentiation becomes critical:
Amenity Innovation 🎯
Standard Brazilian residential projects include pool, gym, and party room. Differentiation opportunities:
- Coworking spaces: Capturing remote work trend
- Pet amenities: Dog parks, pet washing stations (growing pet ownership)
- Sustainable features: Solar panels, rainwater harvesting (appeals to environmentally conscious buyers)
- Security upgrades: Advanced access control, 24/7 monitoring (addresses safety concerns)
Technology Integration 💻
- Smart home pre-wiring (lighting, climate, security)
- High-speed fiber internet infrastructure
- App-based building management and amenity booking
- Electric vehicle charging infrastructure
Developers exploring technology integration can examine how cryptocurrency and blockchain are entering real estate development for cutting-edge positioning.
Design Excellence 🎨
- Engage recognized architectural firms for signature design
- Maximize natural ventilation and light (critical in tropical climate)
- Prioritize outdoor living spaces (balconies, terraces)
- Create Instagram-worthy common areas for social media marketing
Long-Term Market Outlook: Beyond 2027
Sustainability of Growth Trajectory
While projections through 2027 indicate strong appreciation potential, understanding longer-term trends helps developers plan multi-project strategies.
Decade-Long Forecast (2027-2035) 📅
Forecasts for the next decade point to more moderate and sustainable price appreciation compared to the 2021-2024 period of double-digit annual increases[2]. Expected annual appreciation: 5-8% nominal (2-5% real).
Drivers of Moderation:
- Supply catching up to demand as developers enter market
- Infrastructure benefits fully priced into values
- Normalization of interest rate environment
- Maturation of secondary city premium
Implications for Developers:
- Front-load development activity to capture peak appreciation (2026-2027)
- Shift toward operational efficiency and margin optimization as appreciation slows
- Consider vertical integration (construction, property management) to capture additional value
- Explore build-to-rent models as appreciation moderates and yield becomes more important
Infrastructure Completion Timeline and Value Realization
Near-Term Catalysts (2026-2027) 🚀
- Metro line extension completions
- Highway corridor improvements finishing
- Port of Pecém phase one expansion operational
Medium-Term Catalysts (2028-2030) 🏗️
- Additional metro stations opening
- Industrial zone full build-out near Pecém
- Waterfront redevelopment projects completing
Long-Term Catalysts (2031-2035) 🌆
- Regional rail connections to interior Ceará
- Airport expansion and international connectivity
- Smart city infrastructure deployment
Developers timing projects to deliver just before major infrastructure completions can maximize appreciation capture, while those planning longer-term hold strategies should focus on areas benefiting from medium and long-term catalysts.
Emerging Submarkets to Monitor
Praia do Futuro 🏖️
- Currently underutilized beachfront area
- Zoning changes under discussion
- Lower land costs than Meireles/Iracema
- Potential for significant appreciation if development restrictions ease
Eusébio 🏘️
- Adjacent municipality benefiting from Fortaleza spillover
- Lower prices attracting first-time buyers
- Industrial employment growth
- Metro extension potential
Aquiraz 🌴
- Coastal municipality with resort development
- Mixed residential-tourism opportunity
- Infrastructure improvements connecting to Fortaleza
- Higher risk but potentially higher returns
Conclusion
Fortaleza’s Untapped Residential Boom: Novo PAC Investments Driving 15-30% Price Surges for Developers by 2027 represents a compelling opportunity for mid-sized developers seeking attractive risk-adjusted returns in Brazil’s evolving secondary city landscape. While João Pessoa captures headlines and Florianópolis attracts institutional capital, Fortaleza offers a rare combination of scale, growth fundamentals, and accessible entry points that savvy developers can leverage before widespread market discovery.
The evidence is clear: 13% price appreciation in 2025, 12% rental growth, 78% sales volume increases, and 5.8% rental yields all point to genuine demand fundamentals rather than speculative froth[1][2]. Novo PAC infrastructure investments in port expansion, metro extensions, and highway improvements are creating value corridors that informed developers can target before appreciation fully materializes.
Actionable Next Steps for Developers 🎯
Immediate Actions (Next 30 Days):
- Conduct market reconnaissance: Visit Fortaleza to tour target neighborhoods, meet local brokers, and assess competitive projects
- Engage local partners: Identify potential joint venture partners with land access and regulatory expertise
- Analyze specific sites: Request preliminary site information on 5-10 potential acquisition targets across different submarkets
- Model financial scenarios: Build pro formas for representative projects in luxury, mid-market, and economic segments
Short-Term Actions (30-90 Days):
- Secure site control: Execute letters of intent or option agreements on priority sites
- Initiate due diligence: Conduct title review, environmental assessment, and zoning verification
- Develop preliminary designs: Engage architects for concept designs and unit mix optimization
- Arrange financing: Establish relationships with Brazilian construction lenders and equity partners
Medium-Term Actions (90-180 Days):
- Submit permit applications: Begin formal approval process with municipal authorities
- Finalize site acquisition: Close on land purchases or execute final partnership agreements
- Launch pre-sales: Begin marketing and sales activities to gauge demand and generate early revenue
- Execute construction contracts: Finalize agreements with general contractors and key subcontractors
The window of opportunity is open but narrowing. As infrastructure projects progress and more developers recognize Fortaleza’s potential, land prices will rise, competition will intensify, and the early-mover advantage will diminish. Developers who act decisively in 2026 can position themselves to capture the projected 15-30% price surges through 2027 while building platform presence for sustained activity in this emerging market.
For developers ready to explore opportunities in Brazil’s dynamic real estate landscape, connecting with experienced development partners can accelerate market entry and reduce execution risk. The Fortaleza opportunity is real, substantial, and time-sensitive—the question is whether your organization will be among those who capitalize on it.
References
[1] Fortaleza Good Time – https://thelatinvestor.com/blogs/news/fortaleza-good-time
[2] Invest In Real Estate Fortaleza Complete Guide – https://www.jarniascyril.com/international-real-estate/investing-brazil-real-estate/invest-in-real-estate-fortaleza-complete-guide/