Brazil needs 8 million new housing units — and the federal government is spending over R$100 billion to close that gap. Yet the distribution of where those units will actually land is far from even. Brazil’s 2026 Housing Pipeline Map: Which Cities Will Add the Most New Units by 2030? is not just a planning exercise — it is a high-stakes race between demographic pressure, federal program funding, and private construction capacity. Understanding which cities are winning that race — and which are falling dangerously behind — is essential for investors, urban planners, and families navigating Brazil’s housing market through the end of this decade.
Key Takeaways 📌
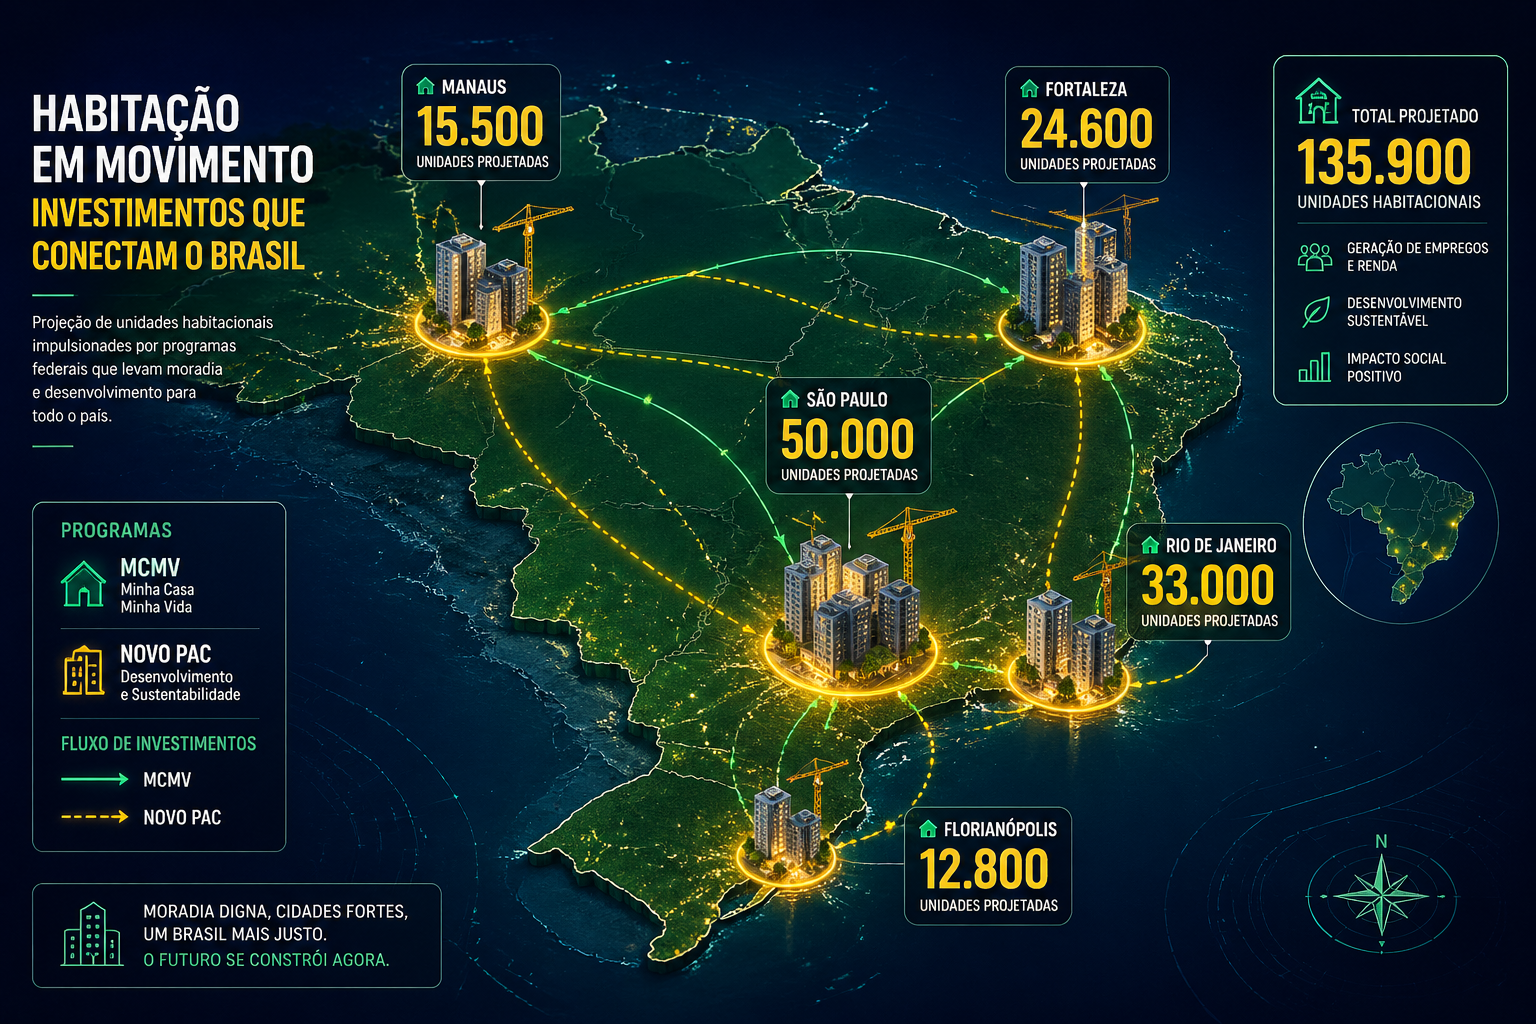
- São Paulo, Fortaleza, Manaus, and Goiânia are projected to lead new housing unit additions through 2030, driven by MCMV (Minha Casa, Minha Vida) and Novo PAC funding.
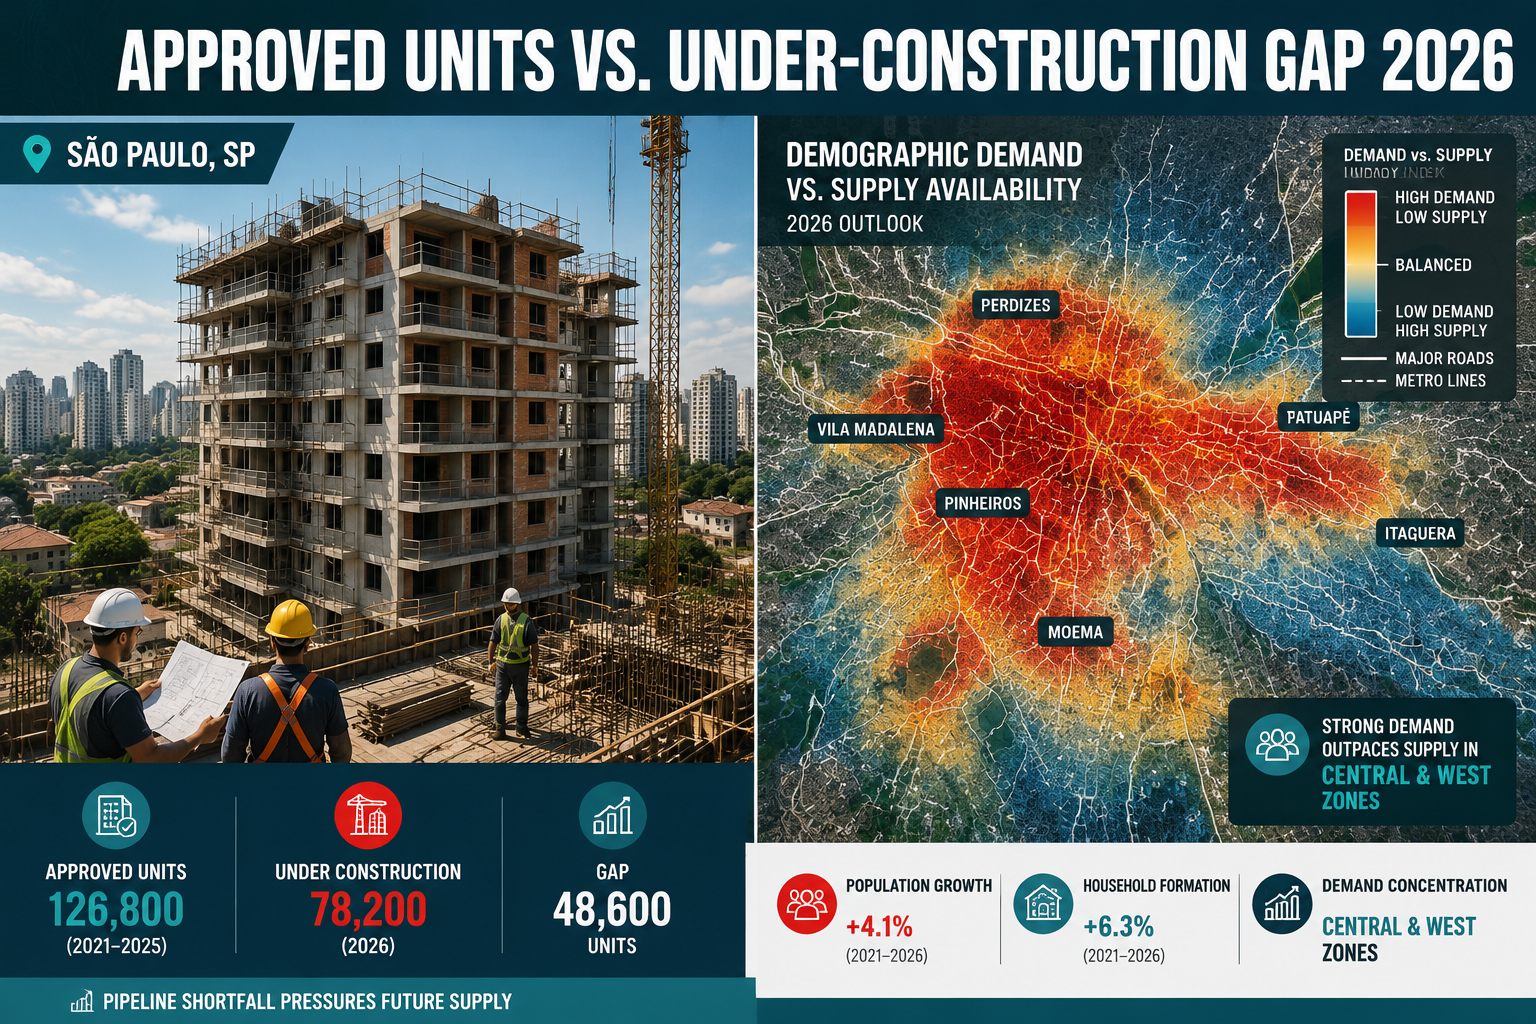
- A significant gap exists between approved projects and units actually under construction — in some cities, fewer than 40% of approved units have broken ground.
- Demographic demand in the North and Northeast regions is outpacing supply faster than in the Southeast, creating urgent investment opportunities.
- Florianópolis is emerging as a surprising mid-size market with outsized pipeline growth relative to its population.
- Private developers are concentrating activity in cities with strong infrastructure commitments from Novo PAC, creating a two-speed housing market across Brazil.
The Structural Housing Deficit Driving Brazil’s 2026 Pipeline
Brazil’s housing deficit is not a new story — but the scale of the federal response in 2026 is unprecedented. The relaunched Minha Casa, Minha Vida (MCMV) program, combined with the Novo PAC (Programa de Aceleração do Crescimento) and the newer Reforma Casa Brasil initiative, has injected record capital into residential construction across all five regions of the country.
The Fundação João Pinheiro, Brazil’s primary housing deficit research body, estimates the national shortfall at approximately 8 million units, with roughly 80% of that deficit concentrated in households earning up to three minimum wages. This concentration shapes everything — from which cities receive MCMV contracts to where private developers can profitably build with federal subsidies.
What “Pipeline” Actually Means in the Brazilian Context
When analysts refer to Brazil’s housing pipeline, they are tracking three distinct stages:
- Approved/Licensed Units — Projects that have received municipal approval but have not yet started construction.
- Under-Construction Units — Active building sites with confirmed financing and permits.
- Delivered Units — Completed homes handed over to buyers or beneficiaries.
💡 The gap between Stage 1 and Stage 2 is where most of Brazil’s housing promise gets stuck. In 2026, industry data suggests that nationally, fewer than half of licensed residential units have transitioned to active construction — a bottleneck driven by financing delays, land titling issues, and infrastructure gaps.
Understanding this pipeline distinction is critical for anyone using Brazil’s 2026 Housing Pipeline Map: Which Cities Will Add the Most New Units by 2030? as a decision-making tool.
City-by-City Breakdown: Brazil’s 2026 Housing Pipeline Map — Which Cities Will Add the Most New Units by 2030?
🏙️ São Paulo Metropolitan Region — The Undisputed Volume Leader
São Paulo remains Brazil’s largest housing construction market by a wide margin. The metropolitan region — encompassing over 21 million people — is expected to add between 350,000 and 420,000 new units between 2026 and 2030, according to projections from the Secovi-SP (São Paulo’s real estate union) and Novo PAC commitments.
Key drivers include:
- MCMV contracts concentrated in municipalities like Guarulhos, Osasco, and São Bernardo do Campo.
- Private mid-market launches (Padrão Médio) accelerating in neighborhoods with new metro and BRT corridors.
- State government partnerships subsidizing land acquisition for social housing.
The challenge: São Paulo’s pipeline is large but fragmented. Dozens of small-scale projects face delays due to environmental licensing and infrastructure connection requirements. The city’s sheer volume masks a patchwork of progress.
🌊 Fortaleza and the Northeast Surge
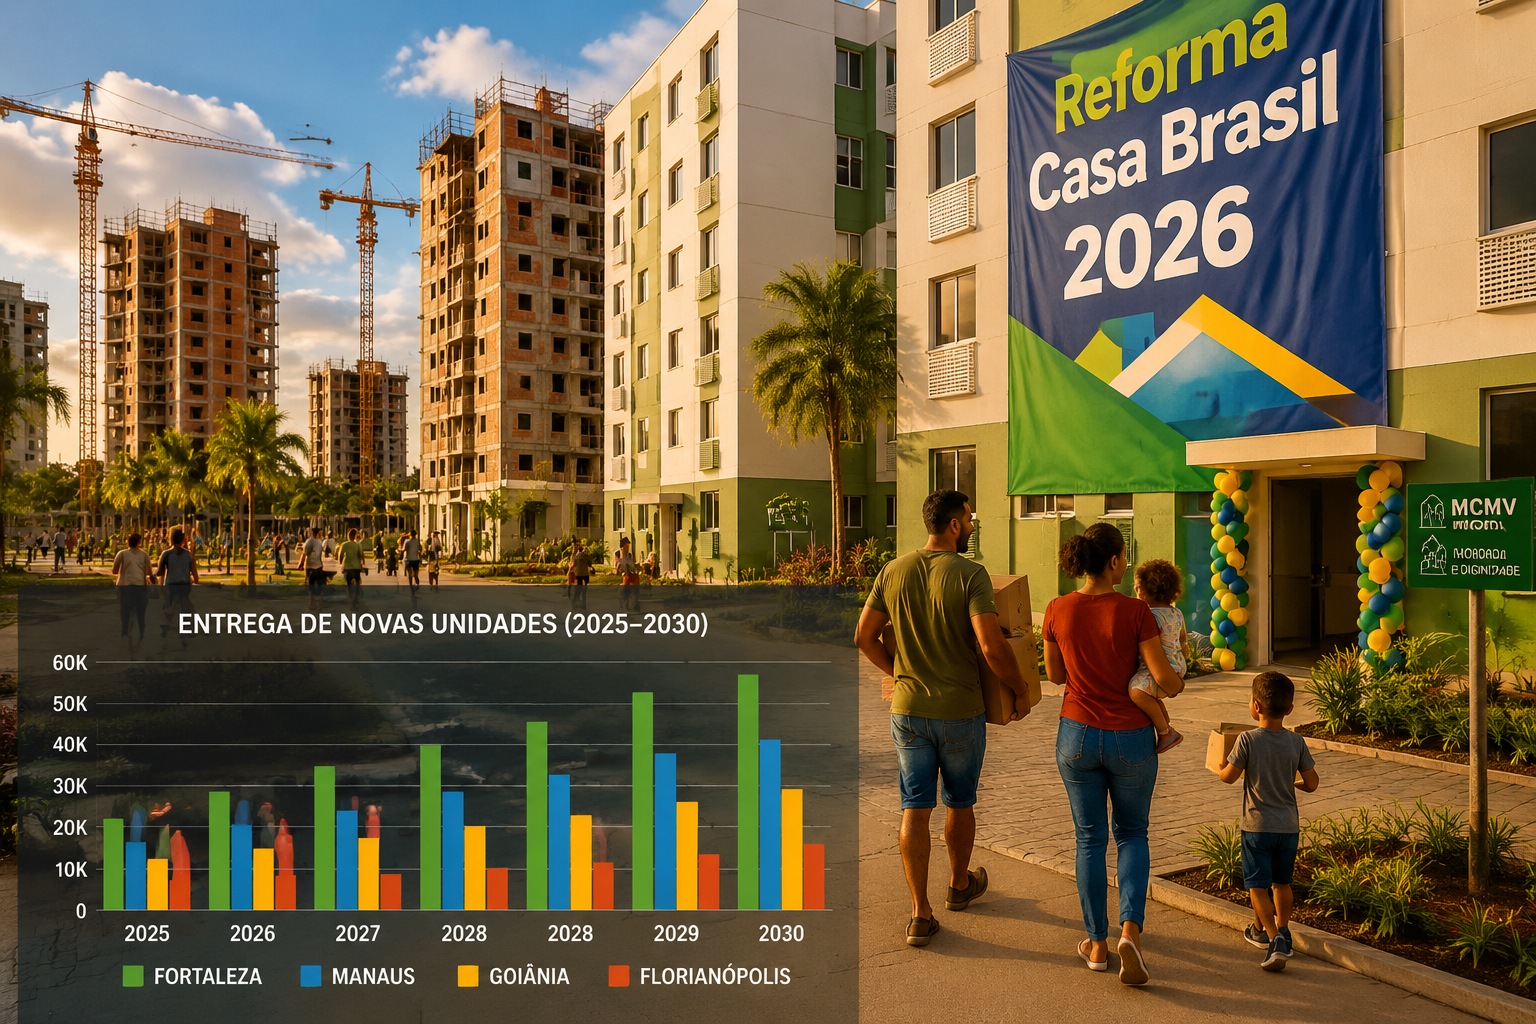
Fortaleza is arguably the most dynamic housing market in Brazil’s Northeast in 2026. The city and its metropolitan region — home to over 4 million people — have seen a dramatic acceleration in MCMV Phase 3 and Phase 4 contracts, with projections suggesting 80,000–100,000 new units by 2030.
What makes Fortaleza stand out:
- Lower land costs compared to Southeast capitals enable faster project viability.
- Strong demographic growth, with a young population driving first-home demand.
- Novo PAC infrastructure investments (sanitation, roads) unlocking previously unserviceable land.
Neighboring cities — Caucaia, Maracanaú, and Eusébio — are absorbing overflow demand and are increasingly appearing in MCMV contractor maps as preferred delivery zones.
🌿 Manaus — The North’s Housing Frontier
Manaus is one of the most underappreciated stories in Brazil’s housing pipeline. With a population exceeding 2.2 million and a housing deficit that the Câmara Brasileira da Indústria da Construção (CBIC) estimates at over 150,000 units, the city is receiving significant Novo PAC and MCMV attention in 2026.
Projected new units by 2030: 60,000–80,000, with the majority in the MCMV Faixa 1 and Faixa 2 income brackets.
Key constraint: Manaus faces unique logistical challenges — building materials arrive by river, land titling in peri-urban zones is complex, and infrastructure (especially sewage) lags behind construction pace. These factors mean that while the approved pipeline is large, the under-construction ratio remains lower than national averages.
🏗️ Goiânia and the Central-West Momentum
Goiânia, capital of Goiás state, has emerged as one of Brazil’s fastest-growing real estate markets. The city’s pipeline for 2026–2030 is estimated at 70,000–90,000 new units, driven by:
- Strong private sector confidence — Goiânia has one of Brazil’s highest rates of off-plan (na planta) sales conversion.
- MCMV contracts in satellite cities like Aparecida de Goiânia and Senador Canedo.
- Migration from rural Goiás and neighboring states fueling rental and purchase demand.
The Central-West region as a whole is benefiting from agribusiness-linked income growth, which is lifting middle-class housing demand beyond the MCMV bracket.
🌴 Florianópolis — Small City, Outsized Pipeline
Florianópolis punches well above its weight in Brazil’s housing pipeline story. With a population of approximately 560,000, the city’s projected unit additions of 25,000–35,000 by 2030 represent an exceptionally high per-capita pipeline ratio.
Several factors explain this:
- Tech sector migration has driven sustained demand for studio and compact apartments, particularly in the northern coastal zones.
- The growth of the Ingleses region in Florianópolis has attracted significant developer interest, with infrastructure improvements making previously inaccessible land viable.
- Investing in studios in Florianópolis has become a strategic focus for developers targeting the short-term rental and digital nomad market.
- The Florianópolis real estate market’s strong sales performance has validated developer confidence, accelerating new project launches.
For investors tracking Brazil’s 2026 Housing Pipeline Map: Which Cities Will Add the Most New Units by 2030?, Florianópolis represents a high-velocity mid-market opportunity with strong absorption rates.
📊 Comparative Pipeline Summary Table
| City/Region | Projected New Units (2026–2030) | Primary Driver | Pipeline Risk Level |
|---|---|---|---|
| São Paulo Metro | 350,000–420,000 | Private + MCMV | Medium |
| Fortaleza Metro | 80,000–100,000 | MCMV + Novo PAC | Low-Medium |
| Manaus | 60,000–80,000 | MCMV + Novo PAC | High |
| Goiânia Metro | 70,000–90,000 | Private + MCMV | Low |
| Rio de Janeiro Metro | 120,000–150,000 | MCMV + Private | Medium-High |
| Florianópolis | 25,000–35,000 | Private | Low |
| Recife Metro | 55,000–70,000 | MCMV + Novo PAC | Medium |
The Gap Problem: Approved vs. Actually Built
The most important — and least discussed — dimension of Brazil’s 2026 Housing Pipeline Map: Which Cities Will Add the Most New Units by 2030? is the execution gap. Across Brazil, the difference between what is approved on paper and what is actually being built is stark.
Why Units Get Stuck in the Pipeline
Several systemic factors create delays between approval and construction:
- Infrastructure dependencies: MCMV contracts require water, sewage, and road access to be in place before construction begins. In cities like Manaus and Belém, this creates multi-year delays.
- Financing disbursement timelines: Even with Caixa Econômica Federal backing, disbursement schedules often lag behind construction needs, forcing developers to pause work.
- Land regularization: A significant portion of Brazil’s urban land — particularly in the North and Northeast — carries unresolved title issues, blocking construction starts.
- Labor and materials costs: Post-pandemic inflation in construction inputs (steel, cement, labor) has eroded project viability for lower-income brackets, causing some MCMV contracts to be renegotiated or cancelled.
🔑 Key insight: Cities with the strongest pipeline execution rates — Goiânia, Florianópolis, and parts of the Fortaleza metro — share a common trait: pre-existing infrastructure investment that reduces the gap between approval and groundbreaking.
Reforma Casa Brasil: Closing the Gap?
The Reforma Casa Brasil program, announced in late 2025 and operationalized through 2026, aims directly at this execution problem. By bundling infrastructure funding with housing contracts — rather than treating them as separate budget lines — the program intends to reduce the approval-to-construction timeline from an average of 28 months to under 18 months.
Early data from pilot cities (including Fortaleza and Goiânia) suggests the bundled approach is working, with construction start rates on new contracts running approximately 30% higher than under previous MCMV structures.
Investment Implications: Where the Pipeline Creates Opportunity
For real estate investors and developers, Brazil’s housing pipeline map is more than a planning document — it is a forward-looking demand signal. Cities with large, executable pipelines and strong demographic fundamentals represent the best risk-adjusted opportunities through 2030.
Key principles for navigating the pipeline:
- Follow the infrastructure money. Novo PAC investments in sanitation and transport are the clearest leading indicator of where housing supply will actually materialize. Cities receiving major infrastructure commitments today will see housing delivery in 2027–2029.
- Track MCMV contract awards quarterly. The federal government publishes MCMV contract data through the Ministério das Cidades. Spikes in contract awards in specific municipalities signal upcoming construction activity within 12–18 months.
- Differentiate between market segments. MCMV activity (Faixas 1–3) and private mid-market activity often respond to different drivers. Cities like Goiânia and Florianópolis show strength across both segments; cities like Manaus are almost entirely MCMV-dependent.
Investors looking for the best places to invest in Brazilian property should cross-reference pipeline data with absorption rates — high pipeline volume in a city with slow sales absorption signals oversupply risk, not opportunity.
For those interested in specific development projects already underway, active developments like Tramonto and Solis in Florianópolis illustrate how well-positioned developers are capitalizing on the city’s pipeline momentum. The progress on Tramonto’s foundations reflects the execution speed that distinguishes top-tier markets from slower pipeline cities.
Understanding the advantages of buying off-plan in Brazil is also essential — in high-pipeline cities, early-stage purchases in strong developments have historically delivered significant capital appreciation by delivery date.
Regional Patterns and the Two-Speed Housing Market
Brazil’s pipeline data reveals a clear two-speed market emerging by 2026:
Speed One — High Execution Markets:
- Southeast (São Paulo, parts of Minas Gerais)
- Central-West (Goiânia, Brasília surroundings)
- South (Florianópolis, Curitiba, Porto Alegre)
These markets combine private sector depth, stronger municipal governance, and pre-existing infrastructure to convert approved units into delivered homes at above-average rates.
Speed Two — High Deficit, Lower Execution Markets:
- North (Manaus, Belém, Porto Velho)
- Parts of the Northeast (interior cities beyond Fortaleza and Recife)
These markets have the greatest demographic need but face structural barriers that slow pipeline conversion. Reforma Casa Brasil and Novo PAC are targeting these cities specifically — but execution timelines remain longer.
This bifurcation matters enormously for anyone reading Brazil’s 2026 Housing Pipeline Map: Which Cities Will Add the Most New Units by 2030? as an investment or policy guide. Volume of approved units is not the same as volume of delivered homes.
Conclusion: Navigating Brazil’s Housing Pipeline Through 2030
Brazil’s housing construction story through 2030 is one of enormous ambition meeting real-world execution constraints. The federal government’s commitment — through MCMV, Novo PAC, and Reforma Casa Brasil — is genuine and well-funded. But the cities that will actually deliver the most new units by 2030 are those that combine federal program access with strong infrastructure, clear land titles, and private sector participation.
Actionable next steps for different audiences:
- 🏠 Homebuyers: Prioritize cities and developments where construction has already started over those still in the approval phase. Execution risk is real — verify that your chosen development has active financing and a confirmed infrastructure connection timeline.
- 💼 Investors: Focus on Goiânia, Florianópolis, and the Fortaleza metro as the highest-conviction pipeline markets for 2026–2030. Cross-reference MCMV contract awards with private launch data quarterly.
- 🏛️ Policy observers: Watch Reforma Casa Brasil’s bundled infrastructure-housing model as the key experiment of this decade. Its success in pilot cities will determine whether Brazil’s North and Northeast can close the execution gap.
- 🔨 Developers: Cities with Novo PAC infrastructure commitments landing in 2026–2027 represent the best land acquisition windows today — infrastructure delivery in 18–24 months creates the conditions for profitable MCMV and mid-market launches.
Brazil’s housing pipeline is not a single map — it is dozens of overlapping stories playing out at different speeds across a continent-sized country. The cities that win the race to 2030 will be those that solve the gap between what is approved and what is actually built.